I can't hear 6KHz, but "it ought to please any passing bat".
Always the best,
Chris
Always the best,
Chris

@Bob Cordell
Hi Bob,
It's a pity our discussion came to a halt the way it did, so I would like to propose to make a fresh continuation.
Let's concentrate on the one thing that seems to stand between us, being the so called eddy currents.
From my side I never bothered about these eddy current contributions because I firmly believed that the reciprocity theorem was applicable and if so, it would include every electrical aspect of a working Generator.
However you from the other side kept mentioning that eddy currents may have to be taken into closer consideration.
This would imply that you probably place question marks about the validity of the reciprocity theorem in this very case.
Therefore my friendly question to you, in what way do you think that eddy current contribution could be either under or over-estimated in a replacement diagram when determined from the Generators complex impedance measured from the outside.
And just as important, why this supposed misinterpretation could be the case.
Looking forward to hearing from you which may hopefully lead to new insights.
Hans
Hi Hans,
Yes, I agree that we should discuss further this and related issues. I apologize for the slow response here. I am on vacation in Australia and will be returning home after February 8. Let's renew our discussion after that. I'll put up a post after that time so we can get started with a renewed discussion.
Cheers,
Bob
I am back from vacation and have done some simulation.
I am confining my observations to electrical simulations of the cartridge and its equalization, not anything having to do with mechanical effects like the cantilever because I am not qualified to address those issues and am unable to make those measurements.
I now think that Hans' cartridge model is accurate with the 100-pF loading. Furthermore, I think the Eddy current effects are small enough not to matter in this discussion. I simulated Hans' cartridge model with and without the resistors that account for Eddy current effects and found that the resulting frequency response differences were reasonably small. Removing those resistors across the inductors caused the response to increase by 0.25 dB at 11 kHz. At 19 kHz, response was unchanged. At 20 kHz response was down 0.1 dB.
I then simulated the cartridge model with 100-pF loading followed by full RIAA equalization for both the normal cartridge loading circuit and the damped cartridge loading described in my VinylTrak preamp article. In both cases a reasonably accurate RIAA-equalized result was produced. Results were normalized to 40 dB of gain at 1 kHz and gain was checked at 20 Hz, 20 kHz and 40 kHz for each implementation. Gain was 59.6 dB at 20 Hz, identical for both circuits as expected.
For the normal circuit implemented with 100 pF loading, gain at 20 kHz was 20.4 dB, while for the circuit with damped cartridge loading, gain at 20 kHz was 21.1 dB, a difference of +0.7 dB for the damped cartridge loading case. Notably, the difference in gain at 15 kHz was only 0.25 dB.
It appears that the normal case gain at 20 kHz being 0.7 dB below that for the damped case is due to the onset of some high-frequency loss in the normal EQ case, which can be expected.
At 40 kHz, gain for normal EQ is only 9.6 dB due to the expected loss of the cartridge model and loading as expected. At 40 kHz, the damped loading case, gain holds up at 15.4 dB, higher by 5.8 dB. The damping approach falls less at the higher frequencies above the audio band due to heavier resistive loading on the cartridge, making the effect of the 100-pF loading capacitance smaller.
Looking at the response difference at 40 kHz between the 2 approaches, we note that ideally the RIAA equalized response falls at pretty much 6 dB/octave at high frequencies due to the 75-us RIAA time constant. For the damped approach, the gain at 40 kHz is only down 5.7 dB as compared to that at 20 kHz, close to what is expected in the ideal RIAA-equalized case. For the normal cartridge loading case, response is down 10.8 dB at 40 kHz as compared to 20 kHz, much more significant than the damped case and as expected for a normal cartridge loading arrangement at such a high frequency.
The damped cartridge loading is thus very close to that of the normal case up to 20 kHz, but shows desirable extension of RIAA EQ to 40 kHz.
The LTspice simulation files for these cartridge loading comparisons is attached.
Cheers,
Bob
Attachments
Bob,
Thx for taking the time to react.
First let me simplify the LTSpice file that you provided and correct a few errors in the model.
The 380K//5pF in your model should be 328K//5pF, but more important, they should be connected between input and output of the generators model, seemingly small differences but giving noticeable differences.
By using Laplace controlled voltage sources, the circuit diagram can be simplified quite a bit.
Simulating your version driven from an anti-riaa source to get a flat response versus the simplified version including a correction for the 8Khz zero, you can see that results are of course equal but very much simpler to understand.

Point however is that a 8Khz zero results in Rload= (Lcart*2Pi*8000)-Rcart is 17K4 where you used 15K5.
Admittedly the FR becomes less elevated around 30Khz at the cost of a sag between 5Khz and 7Khz.
However when having used the calculated 17K4, you would have seen the FR shown below.

Now there is no sag below 10Khz, but at 30Khz FR has raised by more than 1dB.
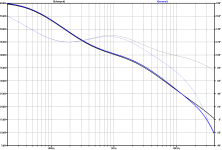
Now combining this with the response of the mechanical part, we come to the image below, where the overall FR can be seen .

This is exactly as was already shown in posting #184.
The .asc file having both your and the simplified model are attached.
And maybe using a lower termination like 15K5 would help to flatten the FR somewhat, although getting a sag between 5Khz and 7Khz should be avoided.
So I still can't see the benefit of using damping.
In case of a cart having a much lower tip mass like 0.25mg, the mechanical part will no longer be the limiting BW factor, so in that case damping will extent the overall FR.
Hans
Thx for taking the time to react.
First let me simplify the LTSpice file that you provided and correct a few errors in the model.
The 380K//5pF in your model should be 328K//5pF, but more important, they should be connected between input and output of the generators model, seemingly small differences but giving noticeable differences.
By using Laplace controlled voltage sources, the circuit diagram can be simplified quite a bit.
Simulating your version driven from an anti-riaa source to get a flat response versus the simplified version including a correction for the 8Khz zero, you can see that results are of course equal but very much simpler to understand.
Point however is that a 8Khz zero results in Rload= (Lcart*2Pi*8000)-Rcart is 17K4 where you used 15K5.
Admittedly the FR becomes less elevated around 30Khz at the cost of a sag between 5Khz and 7Khz.
However when having used the calculated 17K4, you would have seen the FR shown below.
Now there is no sag below 10Khz, but at 30Khz FR has raised by more than 1dB.
Now combining this with the response of the mechanical part, we come to the image below, where the overall FR can be seen .
This is exactly as was already shown in posting #184.
The .asc file having both your and the simplified model are attached.
And maybe using a lower termination like 15K5 would help to flatten the FR somewhat, although getting a sag between 5Khz and 7Khz should be avoided.
So I still can't see the benefit of using damping.
In case of a cart having a much lower tip mass like 0.25mg, the mechanical part will no longer be the limiting BW factor, so in that case damping will extent the overall FR.
Hans
Attachments
Last edited:
To complete things, I lowered the 17k4 resistor for getting the 8Khz zero to 14K3, being some sort of an optimum between a sag that's not to deep and a response at 20Khz that's not too high, while letting the corrective zero at 8Khz.
Result is in the attachment below.
I suspect however that the sag will most likely be noticeable.
Hans
Result is in the attachment below.
I suspect however that the sag will most likely be noticeable.
Hans
Attachments

Hi Hans,Bob,
Thx for taking the time to react.
First let me simplify the LTSpice file that you provided and correct a few errors in the model.
The 380K//5pF in your model should be 328K//5pF, but more important, they should be connected between input and output of the generators model, seemingly small differences but giving noticeable differences.
By using Laplace controlled voltage sources, the circuit diagram can be simplified quite a bit.
Simulating your version driven from an anti-riaa source to get a flat response versus the simplified version including a correction for the 8Khz zero, you can see that results are of course equal but very much simpler to understand.
View attachment 1422466
Point however is that a 8Khz zero results in Rload= (Lcart*2Pi*8000)-Rcart is 17K4 where you used 15K5.
Admittedly the FR becomes less elevated around 30Khz at the cost of a sag between 5Khz and 7Khz.
However when having used the calculated 17K4, you would have seen the FR shown below.
View attachment 1422468
Now there is no sag below 10Khz, but at 30Khz FR has raised by more than 1dB.
Now combining this with the response of the mechanical part, we come to the image below, where the overall FR can be seen .
View attachment 1422469
This is exactly as was already shown in posting #184.
The .asc file having both your and the simplified model are attached.
And maybe using a lower termination like 15K5 would help to flatten the FR somewhat, although getting a sag between 5Khz and 7Khz should be avoided.
So I still can't see the benefit of using damping.
In case of a cart having a much lower tip mass like 0.25mg, the mechanical part will no longer be the limiting BW factor, so in that case damping will extent the overall FR.
Hans
You seemed to be saying that you can't see the benefit of using damped cartridge equalization because once your results of the cartridge cantilever response is included, HF roll-off is pretty bad anyway above the audio band. If that interpretation of mine is correct, I tend to disagree with what you said. My position is that good response out to well beyond 20 kHz is possible, and damped cartridge EQ makes that more possible.
I don't know if you are old enough to remember the CD4 quadraphonic discrete recording process and arrangement pioneered by RCA-Victor in the 1970s. CD4 stood for "Compatible Discrete 4". It employed a 30-kHz carrier that was modulated in FM in simple terms and carried the left front minus the left rear and RF-RL signals and matrixed the results to obtain the LF, RF, RF and RR discrete signals.
For this to work, recorded and received frequency response through the cartridge had to extend to 45 kHz. This was of course a challenge, and overcoming it led to many advances that vinyl recording benefits from to the present day. This includes the Shibata stylus and the so-called "Super Vinyl" that even in stereo records was used by Mobil Fidelity for their records.
Moreover, most of the CD4 setups used moving magnet cartridges, but turntables with low-capacitance interconnects were usually required. Two cartridges that were used were the Shure M94 and ADC-XLM, fitted with Shibata stylus. Of course, demodulators of the time were all analog. Due to continuing availability of vintage CD4 discs, there is a company that actually provides software that can do the demodulation in the digital domain.
My point is that there are living examples of moving magnet cartridge playback that satisfy the ultrasonic frequency response requirements of CD4. Although most of us no longer have interest in CD4, this shows that broadband MM playback is eminently possible, so that damped EQ is capable of providing better ultrasonic capability than traditional EQ that you describe.
This causes me to question some of your vinyl measurement results that show poor HF resonse much above the audio band due to mechanical cartridge stylus/cantilever limitations. Is it possible that your pink noise test disc does not have adequately flat response of the pink noise well into the supersonic range? Might those test discs not be using the super vinyl that is used in CD4 recoding? I note that there were CD4 calibration discs available that had the 30-kHz carrier on them, and are probably available on eBay. Perhaps you should obtain one of these discs and test the performance of some of your cartridges by that means. If you google on something like CD4 playback or CD4 discrete recording you will come up with numerous websites with descriptions of the sorts of thigs I am mentioning here.
Cheers,
Bob
Even a budget cartridge with a conical needle allows you to expand the frequency response to 48 kHz if you organize the input circuit correctly and add a Neumann pole to the RIAA [For this to work, recorded and received frequency response through the cartridge had to extend to 45 kHz. This was of course a challenge, and overcoming it led to many advances that vinyl recording benefits from to the present day. This includes the Shibata stylus
Even a budget cartridge with a conical needle allows you to expand the frequency response to 48 kHz if you organize the input circuit correctly and add a Neumann pole to the RIAA.
Without further comment (words).
I am attaching a PDF document. Unfortunately, I have only found it in my native language.
One word perhaps:
if we want to fully exploit the said frequency range (its upper limit), then this works best with the “Bob Cordell method” - only.
I share these doubts across the board.This causes me to question some of your vinyl measurement results that show poor HF resonse much above the audio band due to mechanical cartridge stylus/cantilever limitations. Is it possible that your pink noise test disc does not have adequately flat response of the pink noise well into the supersonic range?
Nobody really knows which excitation signal was used. Just a few days ago, Mr. Polak said it was a logarithmic sweep and not colored noise.
kindly,
HBt.
Attachments
I'd think that the dominant issue here would be the ability of the non-zero stylus dimension in the direction of travel to properly translate the groove wall. Conical and even the later elliptical shapes are significantly large at 20kHz and greater wavelengths (which also vary with disc diameter), causing geometric errors (distortions).
Fancier later "line contact" shapes both reduced the stylus dimension in the path of travel, to better accommodate smaller wavelengths, and increased the "contact patch", the nebulous area where stylus meets PVC. Contact pressure here is in the tons PSI and the gory details are poorly understood, but (generally) vinyl deformation compliance x stylus effective moving mass (meaning all masses being wiggled by the record surface referred proportionally to the stylus tip), resonates somewhere near the upper range of interest. Line contact shapes contact more of the groove wall so effectively decrease compliance, increasing resonant frequency.
The total system response (at mid-band and above) includes the geometric errors of a stylus riding down a groove wall, the vinyl compliance x ETM resonance, sometimes another resonance of generator inductance and distributed loading capacitance, and our electronics. What is the best choice among the variables we can control (only the last two)? Said another way, what would we wish our high frequency response to look like? The answer has to include the parts we can't control or change.
All good fortune,
Chris
My German is half a century unused, so difficult, but it looks like what I was trying poorly to express.I am attaching a PDF document. Unfortunately, I have only found it in my native language.
All good fortune,
Chris
Yes, but only at near 0 dB levels. And real HF music level @ 20 kHz is no more -20...-30 dB (as you can see in my spectrum measurement @ #209 ) . Therefore even the cone copes well with real music (not 0 dB sine) playback if it is not hindered by 47k/250pConical and even the later elliptical shapes are significantly large at 20kHz and greater wavelengths (which also vary with disc diameter), causing geometric errors (distortions).
Have to disagree. Geometric errors are not level sensitive, but are a background ineradical error of phono playback. Playback stylus shapes approach but do not meet the size of cutting stylus shapes. Not a huge deal, and likely correctable with some fancy DSP, but baked into the system. At least it's not a resonance, only a fairly linear effect.Yes, but only at near 0 dB levels.
All good fortune,
Chris
Hi Bob,This causes me to question some of your vinyl measurement results that show poor HF resonse much above the audio band due to mechanical cartridge stylus/cantilever limitations. Is it possible that your pink noise test disc does not have adequately flat response of the pink noise well into the supersonic range?
Apart from this simple issue about the test disk that was used., I need some extra time to properly answer your questions.
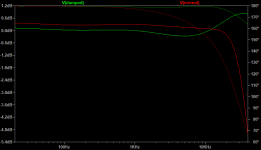
This is what I wrote about the used test disk.
One of the biggest problems found in measuring cartridge frequency response is a suitable test record. Many of those from the ‘golden era’ of vinyl have potential anomalies that skew results. For this testing we used an Riaa corrected pink noise recording from 500Hz to 30kHz on a 45rpm disk from CH Precision. This was computer generated in order to provide accuracy that is rare to find in a test record.
Pink noise has equal energy per octave, and when displaying the FR with a FFT having fixed frequency bin widths, it will show as a negative slope of 10dB/decade.
To verify the correctness of the recorded signal on this disk, record was played back with a Benz LP MC cartridge, whose FR is specified from 10Hz-50Khz within 1dB.
Figure 2, checking the Test signal on the CHPrecision test disk.
Figure 2 seems to fully confirm that the Disk can be used for our purpose as a reference. Up to 28.5Khz the response is within +/- 0.5dB and from there -1.5dB@30Khz.
Does this answer your question so far?
For the other points that you mentioned I need more time to formulate proper answers, because I'm very busy at the moment for another project and especially the CD4 that you mentioned opened an additional interesting pot of worms that will take me some time to study.
Hans
"The used test disk didn't have pink noise but a frequency sweep from 2kHz to 30Khz." [Mr. Polak, 05.02.2024]
Very strange; but let's leave this topic alone.
I like the article in the former GDR magazine radio fernsehen elektronik ... It already says everything we need to know as a minimum and starting point.
I would be interested to hear what a manufacturer (Ortofon, for example) would say about the criticized modeling.
Does Ortofon work without modeling ???
#
Do I understand all the comments correctly?
Bob stands for the possibility of the electrically damped pickup and the necessary follow-up correction by introducing a zero.
Hans wants to prove with his modeling that the usual (may differ slightly) termination is the correct one after all.
Nick would like to have found a way to conjure up sinusoidal curves above 20kHz (even very far inwards) even with a stylus sphere with a diameter of 30µm by means of a low capacitive and above all resistive load and a zero (the so-called Neumann pole), which he also introduced.
Then it must be the shibata - line contact
😉
greetings,
HBt.
Very strange; but let's leave this topic alone.
I like the article in the former GDR magazine radio fernsehen elektronik ... It already says everything we need to know as a minimum and starting point.
I would be interested to hear what a manufacturer (Ortofon, for example) would say about the criticized modeling.
Does Ortofon work without modeling ???
#
Do I understand all the comments correctly?
Bob stands for the possibility of the electrically damped pickup and the necessary follow-up correction by introducing a zero.
Hans wants to prove with his modeling that the usual (may differ slightly) termination is the correct one after all.
Nick would like to have found a way to conjure up sinusoidal curves above 20kHz (even very far inwards) even with a stylus sphere with a diameter of 30µm by means of a low capacitive and above all resistive load and a zero (the so-called Neumann pole), which he also introduced.
My vintage Dual turntable's anti-skate dial has scales for conical, elliptical, and CD4 styluses. "CD4" was probably a more widely-recognized term than "line contact".
Ed
Then it must be the shibata - line contact
😉
greetings,
HBt.
What about looking at the quasi-impulse response of a pop or tick on a record, and then mathematically deriving the frequency response from that? I would think pops and ticks might be fairly broadband. One could even create one on a throw-away record with a rasor blade.Without further comment (words).
I am attaching a PDF document. Unfortunately, I have only found it in my native language.
One word perhaps:
if we want to fully exploit the said frequency range (its upper limit), then this works best with the “Bob Cordell method” - only.
I share these doubts across the board.
Nobody really knows which excitation signal was used. Just a few days ago, Mr. Polak said it was a logarithmic sweep and not colored noise.
kindly,
HBt.
Cheers,
Bob
- Home
- Source & Line
- Analogue Source
- Bob Cordell's VinylTrak