perfectly fine - I'm glad you did it!hope this is cool
you said the tuning is about 25 Hz, right?Both mics are equidistant from the front of the subs.
So for the 80 Hz test I would think you have a lot of bleeding over from driver to port mic and thus very similar readings. The port output so far above tuning should be very very low. The same bleeding over effect affects the other measurements.
At port tuning 25 Hz it's getting interesting.
Your signal does not have a "step" start (as did mine), so the resonator is excited gradually. but there is stilll a very clear difference between the relation of port and driver output at start (low port output) and after some cycles (high port output).
perfectly fine - I'm glad you did it!
you said the tuning is about 25 Hz, right?
So for the 80 Hz test I would think you have a lot of bleeding over from driver to port mic and thus very similar readings. The port output so far above tuning should be very very low. The same bleeding over effect affects the other measurements.
Hi again stv, sorry to disappear....darn power outage from hurricane....on a generator now...
25 Hz, yes.
I meant to include Hornresp's direct and port output predictions, to help make sense of the comparative scope voltages.
80 Hz is marked here, for a little over +16dB, direct output vs port output.
I was surprised that simulated port output is as high as it is, but it does help explain the closer together than expected voltage readings.
I make out the voltage difference of the 80Hz scope shot to be about 9dB, which still leaves about 7 dB of port output unaccounted for.
Perhaps that's 7 dB of bleeding, but it seems small enough that I can't really see bleeding being a big issue, or invalidating the timing comparisons.
I dunno. Assessing very low frequency initial impulse / waveform rises is at best difficult for me.At port tuning 25 Hz it's getting interesting.
Your signal does not have a "step" start (as did mine), so the resonator is excited gradually. but there is stilll a very clear difference between the relation of port and driver output at start (low port output) and after some cycles (high port output).
Looking at the 25Hz comparison magnified 2X, I have a very hard time saying there is clear difference in their initial starts.
Maybe you're seeing / realizing something I'm not???
Oh, in case it helps to visualize the sub/ test setup,
Last edited:
In @hifijim 's great passive 3way-speaker thread while discussing the necessity for perfectly sealed enclosures or the need for a small hole to allow adaptation to atmospheric pressure changes the question arose what speaker system will generate higher internal ensclosure pressure.
In my understanding PR and vented speakers would generate higher internal pressure than sealed speakers.
Intuitively that may seem wrong, as the PR or vent can act as a "pressure release valve", but that is only the case for (very) low frequencies. At the tuning frequency the PRs or the air in the vent swings in sync with the driver, thus adding up to the internal (and external) pressure, to generate additional SPL.
@DualTriode stated that sealed speakers will still generate higher pressure and I was not sure anymore whether my general assumption was actually correct.
@David McBean kindly pointed me to the possibility to plot the internal pressure of speakers in hornresp, so I will show some examples.
I use a model of my test speaker for vent vs. PR investigation - same internal volume for all variants.
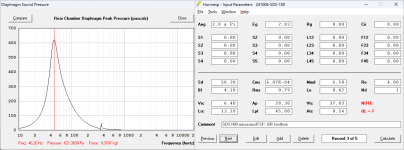
First the internal pressure plot for the vented speaker at 2,83 V input:
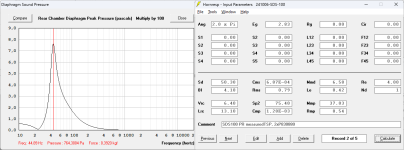
Next the passive radiator speaker (with a very similar tuning):
And the sealed speaker:
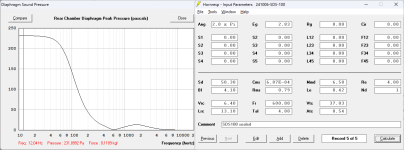
as to be expected the resonator systems have very low pressure below tuning frequency, that is why those speakers need a low frequency protection with high levels.
The maximum pressures:
vented speaker: 621 Pa slightly below tuning
PR speaker: 764 Pa again slightly below tuning
sealed speaker: 232 Pa at the lower end of the scale (presumably will not rise much further)
The difference between vented and PR speaker is because of the Q of the resonator, that can be observed by looking at the minimum impedance at tuning frequency and could easily be made equal by raising the QL of the vented speaker. In that case also the vented speaker would generate a pressure of around 750 Pa.
Of course vented and PR speaker have a much higher SPL output of 85 dB at their tuning frequency (50 Hz), while the sealed speaker has a tuning frequency of 87 Hz and SPL at 50 Hz is down to 76 dB.
So I increased the input voltage for the sealed speaker to achieve the same SPL for the sealed enclosure (8 V that is +9dB):
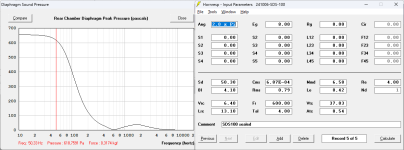
now the internal pressure at 50 Hz is about 619 Pa (very similar to the vented speaker) and rises further at lower frequencies.
what happens if I reduce the sealed speaker volume to 2 liters?
tuning frequency rises to 110 Hz and for 85 dB at 50 Hz I need even more power:
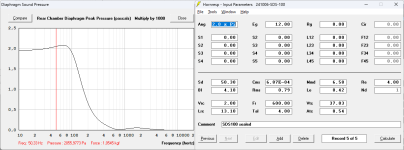
now the internal pressure rises to 2056 Pa at 50 Hz! But also the power is now 18-fold!
So I guess there is no definitive answer - it very much depends on the definitions and assumptions.
It also confirms my experience that pressure in vented/PR speaker will get high at tuning frequency and air leaks will degrade sound.
In my understanding PR and vented speakers would generate higher internal pressure than sealed speakers.
Intuitively that may seem wrong, as the PR or vent can act as a "pressure release valve", but that is only the case for (very) low frequencies. At the tuning frequency the PRs or the air in the vent swings in sync with the driver, thus adding up to the internal (and external) pressure, to generate additional SPL.
@DualTriode stated that sealed speakers will still generate higher pressure and I was not sure anymore whether my general assumption was actually correct.
@David McBean kindly pointed me to the possibility to plot the internal pressure of speakers in hornresp, so I will show some examples.
I use a model of my test speaker for vent vs. PR investigation - same internal volume for all variants.
First the internal pressure plot for the vented speaker at 2,83 V input:

Next the passive radiator speaker (with a very similar tuning):

And the sealed speaker:

as to be expected the resonator systems have very low pressure below tuning frequency, that is why those speakers need a low frequency protection with high levels.
The maximum pressures:
vented speaker: 621 Pa slightly below tuning
PR speaker: 764 Pa again slightly below tuning
sealed speaker: 232 Pa at the lower end of the scale (presumably will not rise much further)
The difference between vented and PR speaker is because of the Q of the resonator, that can be observed by looking at the minimum impedance at tuning frequency and could easily be made equal by raising the QL of the vented speaker. In that case also the vented speaker would generate a pressure of around 750 Pa.
Of course vented and PR speaker have a much higher SPL output of 85 dB at their tuning frequency (50 Hz), while the sealed speaker has a tuning frequency of 87 Hz and SPL at 50 Hz is down to 76 dB.
So I increased the input voltage for the sealed speaker to achieve the same SPL for the sealed enclosure (8 V that is +9dB):

now the internal pressure at 50 Hz is about 619 Pa (very similar to the vented speaker) and rises further at lower frequencies.
what happens if I reduce the sealed speaker volume to 2 liters?
tuning frequency rises to 110 Hz and for 85 dB at 50 Hz I need even more power:

now the internal pressure rises to 2056 Pa at 50 Hz! But also the power is now 18-fold!
So I guess there is no definitive answer - it very much depends on the definitions and assumptions.
It also confirms my experience that pressure in vented/PR speaker will get high at tuning frequency and air leaks will degrade sound.
No, the "wind" (pressure) just counteracts the voice coil force.then the driver with Voice Coil will be not be stationary, but be pushed around by the wind.
I'll see whether i can provide all those measurements!
Thanks @DualTriode!
Basically this paper states that a simulation can be quite accurate.
Here is a klippel-paper excerpt of (both) cone displacements and the voice coil current:
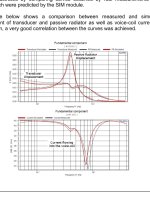
The tuning is 45 Hz, the max displacement of PR is sligthly below tuning. The local current maximum (local impedance minimum) is at tuning frequency and corresponds to a local driver displacement minimum.
The resonator is obviously not lossless (lower Q) and thus the driver displacement is not reduced to zero at tuning frequency.
I can try to replicate those graphs in hornresp.
Basically this paper states that a simulation can be quite accurate.
Here is a klippel-paper excerpt of (both) cone displacements and the voice coil current:

The tuning is 45 Hz, the max displacement of PR is sligthly below tuning. The local current maximum (local impedance minimum) is at tuning frequency and corresponds to a local driver displacement minimum.
The resonator is obviously not lossless (lower Q) and thus the driver displacement is not reduced to zero at tuning frequency.
I can try to replicate those graphs in hornresp.
Last edited:
Just a very short sign of life:
I finally made some progress to find (some or the?) relevant parameters that seem to define the compression behaviour of my measured ports of post #704.
Depending on (1) the ratio of port length to exit diameter and (2) the ratio of port length to mid (or min.) port diameter there are (1) minimum strouhal- (STR) and (2) mid-port-strouhal-numbers (MPSN) that should not be underrun to avoid compression.
Generally longer ports allow lower STR and MPSN.
As I mentioned and as I suppose short ports are more susceptible to turbulent flow, because of eddy flow disturbance at the port entrance/exit.
I am also preparing an excel tool for iterative port optimization.
Using enclosure volume, desired tuning frequency and max. port output SPL the tool will provide an optimized geometry using the parameters mentioned above.
That is still quite limited for a PR.
Like a driver, the compliance of a PR eventually also behaves non-linear.
So ideally I would expect to see some kind of Kms/Cms(x) curve as well.
This doesn't only determines the excursion (at a certain drop of the compliance), but is also very important for the Vas.
Just as a fun exercise, simulate the same cabinet with a PR (at max excursion) with a 50% drop in Cms and see what it does to the cone excursion of the PR.
(As well as for the system, but that is quite obvious since the tuning freq shifts.)
That can change quite drastically!
Just a small addition to the comparison of the suggested "ideal" port geometries by Roozen (NFR~0.1) and Salvatti et al (NFR~0.5):I think I found the relevant factor for different optimal geometries as found by Roozen and Salvatti et al.
It's in fact quite obvious, but you had to beat me to it!
Thanks for that!
Roozen has tested long ports for a small woofer and a small enclosure.
Length is not provided in the paper, but the main resonance is said to be at 1100 Hz. That translates to a lenght of 15 cm.
Min. port diameters vary between 1,6 to 2,1 cm,
Thus a Length/Dmin ratio between 7,2 and 9,6.
Salvatti et al provided the port length with 120 mm and differing min. diameters between 58 and 69 mm.
Thus a Length/Dmin ratio between 1,75 - 2,05.
While the NFR and the length/diameter ratios vary quite substancially both suggest "ideal" (or best compromise) geometries that have a ratio of Amax/Amin of 2.
(Amax = port area at exit, Amin = port area at minimum middle section).
That might simplify my port optimizer!
I'll post my findings!
Another quick teaser before I post details to explain the results that I was able to condense from my measurements (see post #704 plus 2 more measurements):
If the middle port cross section area is smaller than 50% of the exit cross section it will be the only limiting factor and it is a waste of space to keep the endings bigger than necessary.
similarly if the ends of the port have a surface smaller than 200% of the (minimum) mid port surface the ends are the limiting factor and it is again a (big) waste of space and unnecessary port length.
I will present graphs showing how different port geometries have their very specific limiting factor.
A I wrote in the previous post also both suggested ideal ports proposed by Roozen and Salvatti/Button/Devantier in their papaers have exactly the same surface ratio (2 for surface or 1.41 for diameter/radius).
This ratio is very useful, because we only need to observe the port exit turbulent behaviour that relates to the STROUHAL number. No new "mid port strouhal number" parameter needed!
NB: per definition this end cross section surface does not include the increase related to port roundover (making calculation and modeling even simpler!).
a long port is less disturbed by eddy flow disturbance at the port entrance/exit. This can be measured by looking at the compression behaviour of the port.
long ports with a length/exit diameter ratio of 4 or more allow a STROUHAL number of ~0.5 or even less
short ports with a lenth/exit diameter ratio of 2,5 or less only allow STROUHAL numbers of 1 or even more
the correlation is not linear and even shorter ports will behave much worse (thus needing much more surface to be non-compressing).
using these two rules will allow to do a simple estimation of necessary/ideal port geometry and dimension for a certain maximum port output.
as far as I can think it does not allow a straightforward formula, because the port lenght/diameter ratio changes with every optimisation step and that in return changes the allowed strouhal number minimum, changing the necessary diameter again.
but fortunately EXCEL allows iterative calculation steps!
a simplified formula would be possible if we accept some "safety margin" for long ports and keep STROUHAL number above 1.
Rule N° 1: Make the end cross section surface of the port double the smallest mid port cross section surface
simply speaking:If the middle port cross section area is smaller than 50% of the exit cross section it will be the only limiting factor and it is a waste of space to keep the endings bigger than necessary.
similarly if the ends of the port have a surface smaller than 200% of the (minimum) mid port surface the ends are the limiting factor and it is again a (big) waste of space and unnecessary port length.
I will present graphs showing how different port geometries have their very specific limiting factor.
A I wrote in the previous post also both suggested ideal ports proposed by Roozen and Salvatti/Button/Devantier in their papaers have exactly the same surface ratio (2 for surface or 1.41 for diameter/radius).
This ratio is very useful, because we only need to observe the port exit turbulent behaviour that relates to the STROUHAL number. No new "mid port strouhal number" parameter needed!
NB: per definition this end cross section surface does not include the increase related to port roundover (making calculation and modeling even simpler!).
Rule N°2: The minimum allowed STROUHAL number is related to the port lenght/port exit diameter ratio.
again simplified:a long port is less disturbed by eddy flow disturbance at the port entrance/exit. This can be measured by looking at the compression behaviour of the port.
long ports with a length/exit diameter ratio of 4 or more allow a STROUHAL number of ~0.5 or even less
short ports with a lenth/exit diameter ratio of 2,5 or less only allow STROUHAL numbers of 1 or even more
the correlation is not linear and even shorter ports will behave much worse (thus needing much more surface to be non-compressing).
using these two rules will allow to do a simple estimation of necessary/ideal port geometry and dimension for a certain maximum port output.
as far as I can think it does not allow a straightforward formula, because the port lenght/diameter ratio changes with every optimisation step and that in return changes the allowed strouhal number minimum, changing the necessary diameter again.
but fortunately EXCEL allows iterative calculation steps!
a simplified formula would be possible if we accept some "safety margin" for long ports and keep STROUHAL number above 1.
The breakthrough: Finding compression behaviour patterns
Updated measurements
I added two ports to my collection of compression behavior data (#704) that were used for the “PR vs PORT” comparison (#753) and removed the SONY woofer data due to their apparent non-linearity at low levels. This driver seems to compress at low levels, making the compression reference value difficult to determine.STR, MPSN and other parameters
Strouhal number (STR) is an established parameter of oscillating flow dynamics. In the case of loudspeaker ports it is the ratio between port exit radius and the respective peak air particle displacement (but not peak-peak!). This is the top diagram in the images.STR = (port exit radius) / (port exit particle displacement)
Mid Port Strouhal Number (MPSN) is a parameter I introduced. It defines a similar relation between the narrowest port radius (in the mid section) and the respective air particle displacement in that area.
I removed the x100 factor from the Mid Port Strouhal Number (MPSN) scale and made the X axis linear, like for the STR graph. It is interesting to see the direct relation between Strouhal number and mid port Strouhal number. This is the diagram in the center of my images.
MPSN = (mid port radius) / (mid port particle displacement)
STR and MPSN have a ratio that is the cube of the port exit diameter and port minimum diameter ratio.
Both STR and MPSN are simplified values that do not consider air speed variations over the port cross section.
A lower number for STR or MPSN indicates higher air displacement/air speed.
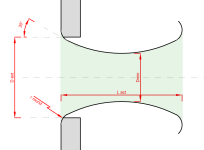
Lact = the actual port length (no end correction factor added)
Dmin = minimum diameter of port at the mid port section
Dext = exterior port opening diameter, but without including the increase due to roundover
Looking for patterns
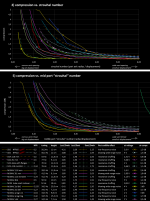
I looked at these curves for a long time, trying to find correlations or patterns.
I also plotted compression/velocity and compression/acceleration graphs but the two parameters relating compression to port radius/air particle displacement were still the most telling (that is: STR and MPSN).
One general observation is that some curves are more rounded with gradual bend on the right area of the diagram while others have a are sharp bend more at the left side. Also, there are some curves that bend both at the lower STR and MPSN range, while others differ significantly between STR and MPSN.
There are some exceptional curves, such as the green MONACOR tube port curve. This port starts compressing very early (see extreme right end of the MPSN graph). It is limited by its rather sharp ends creating chuffing and turbulent flow and will be excluded from further discussion.
Generally, port geometries with curves that have a sharper bend on the left side of the diagrams are BETTER, because they allow a lower port diameter sizes (that translates to lower allowed STR and MPSN numbers).
Optimum would be a port that has both STR and MPSN graphs bend up (and compress) as far as possible on the left side.
Pattern No1: Similar MPSN curves 1
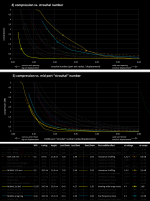
Here are isolated port graphs with similar shape on the MPSN diagram. In other words, these ports behave similarly regarding the compression behavior related to the air particle displacement at the narrowest part of the port. They are also the best behaving ports in the MPSN diagram, 1 dB compression around MPSN values of 0.15.
If you look at the related ratios of port Length and Port minimum diameter (Lact/Dmin) in the port table, they are all quite similar and rather high, between 6.12 and 7.20. Long ports (related to diameter) behave better regarding the onset of compression!
While the MPSN graphs are very similar, the STR graphs are VERY different!
This difference of graphs is related to the Dext/Dmin ratio that defines how flared the ports are. The very well behaving yellow MONACOR 3d BIG port has a low Dext/Dmin ratio of 1.50 (translating to a surface ratio of 2,25 or a STR/MPSN ratio of 3,375), the flare rate is relatively low. The other ports have much bigger flares, but still have the same MPSN behavior.
This means that the big flares leading to more rounded STR curves do not have any benefit compared to the low flare port, because these ports are all limited by the minimum mid section diameter. Extending the mouth diameter leading to higher Dext/Dmin (or flare) ratios has no benefit.
The Dext/Dmin ratio of the yellow MONACOR 3d BIG port of 1.5 on the other hand is at the optimum and should not be lowered much further because that also has no benefit, as can be seen with pattern No3 below.
Pattern No2: Similar MPSN curves 2

These ports are shorter with a Lact/Dmin ratio between 3.33 – 4.90.
They have a compression of 1 dB at MPSN between 0.2 and about 0.35.
STR behaviour differs slightly, MONACOR 3d SM port has the lowest STR number (~1) for 1 dB compression. Dext/Dmin ratio: again 1.50 - the other ports have bigger flare rate but again do not gain benefit from it.
Pattern No3: similar STR curves 1
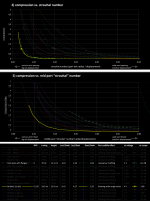
These ports share similar Strouhal number behaviour (related to port opening radius). The common parameter here is the Lact/Dext ratio, between 3.42 and 4.27. These are still long ports but these numbers are slightly lower than in pattern 1, because they relate to the bigger opening diameter Dext, not the small Dmin.
Here you can see a very strong difference of MPSN related compression behaviour: The yellow MONACOR 3d BIG port is more effective in utilizig the maximum from the mid port diameter having a sharp bend at the left side, while the straight SICA tube port has a very gradual curve because the compression behaviour is dictated by STR number and not MPSN. It “wastes” mid port diameter (and subsequently length) that would not have been necessary.
I should add that the necessary port length is mainly defined by the minimum port diameter, so trying to keep the Dmin as small as possible helps to keep ports short, thus save space (and push port resonances up).
This again confirms the best Dext/Dmin ratio around 1.5 (Roozen and Salvatti/Button/Devantier suggest a similar 1.41)
Pattern No4: somewhat similar STR curves 2
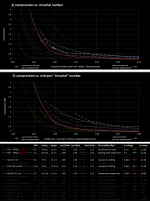
These ports are similar in their Lact/Dext ratio of 1.90 – 2.46, rather short and start compressing 1 dB around STR numbers between 1.5 and 2.5. The small length with air direction changes at entrance and exit does not easily allow forming of a continuous, non disturbed oscillating flow at higher displacement values.
These examples also show that for short ports it may be beneficial to have a slightly bigger flare ratio with Dext/Dmin ratios around 2. But I think it would be even more beneficial to just make the port slightly bigger (and longer!) to allow a better undisturbed air flow.
Pattern No5: similar distribution of STR and MPSN curves
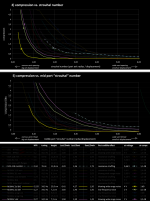
These curve distributions indicate best utilization of both end and mid port diameters, because they have a very similar order and distribution at STR and MPSN diagrams – following the “ideal” Dext/Dmin ratio of 1.50.
First I did not want to include the SICA 118mm0.34 port here, because it does not fit so well, but then again it’s a good indication that a slightly higher Dext/Dmin ratio of 1,75 already “wastes” the big flares because it is limited by small central diameter (look at the more gradual STR curve).
The next update will finally include the port optimizer tool, as promised!
Last edited:
Fantastic work stv! I look forward to the updated spreadsheets and hope to use these ports in my projects going forward.
That would be great!
I'd love to create a web app from the optimizer sheets when they're ready!
Of more interest to some of us is how they perform Vs (big) pipe vent, critically damped.
Oh, for sure! And if we can get a decent calculator we can create and share fully parameterized CAD models based on the optimizer calculations, and then anyone with a 3D printer can print, test, measure, and validate.
Where is the most recent spreadsheet for this wunder port? Have a 15 subwoofer that is bugging me to try it out.
I'll probably form the port via the methods on the Australian website. I don't have a DDD printer, but I do have the other stuff.
I'll probably form the port via the methods on the Australian website. I don't have a DDD printer, but I do have the other stuff.
"wunder port" 😆Where is the most recent spreadsheet for this wunder port?
In essence this port and its geometry is nothing really new - but I might have found an easy way for reasonable port dimensioning.
The most recent spreadsheet still only exists in my head, partially in my paper notebook and partially on my computer - I promise it will not take much longer for me to publish it here. Give me one or two more weeks.
It took me some time to find the geometric solution for calculating the NFR (normalized flare rate), needed for the tuning calculation.
The last published spreadsheet for helmholtz tuning calculation with flared ports are in post #747 (metric) and #748 (imperial).
The new port optimizer spreadsheet will be different and much more user-friendly.
it will provide a precise geometry proposal (including a rough graphic representation) based on only three parameter inputs:
- enclosure volume Vb
- desired tuning frequency Fb
- maximum desired port output SPL
- First the spreadsheet will calculate the necessary air displacement for the desired Fb and max SPL, based on a formula provided here in a thread on diyaudio.
- Then it will estimate the necessary exterior port diameter based on air displacement and an initial, big minimum allowed STR (=strouhal number).
- The minimum port diameter will be defined as Dext/1.5 (found to be the optimum, see post #812).
- Based in these values the necessary port lenght can be calculated via the formula and correction values used in the calculator of posts #747/748.
- The length/max. diameter ratio will now define the updated (and smaller) allowed min. STR value, on which the next iteration of geometry calculation will be based.
I initially thought of letting the spreadsheet calculator make the iterations in calculation steps by pressing a key, but I will now just make a number of iterations in consecutive spreadsheet rows. This allows a very easy inspection of the iteration process. also, iteration steps can be easily added by inserting rows.
Based in these values the necessary port lenght can be calculated via the formula and correction values used in the calculator of posts #747/748.
How will you determine NFR to use at this stage, since you don't have the Port Length yet? It seems like there are two variables left to solve for (Port Length and NFR).
My attempt at some formulas (ignoring the correction factor, since that makes things more complicated):
distance = 1m
rho0 = 1.2 kg/m^3
displacementVolume = SPL_pascals * distance / (rho0 * frequencyHz ^ 2 * pi)
peakVelocity = displacementVolume * 2 * pi * frequencyHz
Dmax= displacementVolume * initialStrMin * 2 (from your previous comment: "STR = (port exit radius) / (port exit particle displacement)")
Dmin = dMax / 1.5 (from your comment: "minimum port diameter will be defined as Dext/1.5")
Amax = (Dmax / 2) ^ 2 * pi
Amin = (Dmin/ 2) ^ 2 * pi
I'm not sure what units Dmax ends up as here, since the STR number is dimensionless, but only considering radius and displacement in the STR-related computations results in a Dmax with a volumetric unit, e.g, something like "8.19 Liters". I'd like to assume it somehow translates directly to something like 8.19 cm, since that's a very reasonable diameter, but I can't form an argument as to why doing that would work.
Even if the diameter units are solved, I don't know where to go from here. I think I'm just missing a way to compute NFR without the Length.
So, I'm guessing this comment is telling us the secret sauce is still all in your brain 🙂 :
It took me some time to find the geometric solution for calculating the NFR (normalized flare rate), needed for the tuning calculation.
As for the (Big) Initial Minimum STR, what are you considering for a good starting value?
- Home
- Loudspeakers
- Multi-Way
- Investigating port resonance absorbers and port geometries
