I get the parallel circuits. It's odd then that it seems in the chart above that the largest effects Semi LE has on the impedance curve seem well above Fs. I am learning a large amount in this thread... which I may hope I never have to use.... Thanks everyone.
🤣
🤣
The Semi-Le model does help with modelling the low-frequency response of a loudspeaker driver in an enclosure. But it also produces a more accurate model of a driver's impedance behavior at high frequencies well above the driver's free-air resonance frequency. This includes getting the phase response of the impedance correctly modelled, which is critical to crossover network design. The Semi-Le model is well suited to midrange drivers and tweeters and not just woofers.So Semi Le is a tool for low end modelling of an enclosure, as opposed to the crossover?

I don't see why Semi-Le parameters could not be utilized by crossover design programs. They may not be, but they can be.Semi-Le parameters are NOT for use with crossover design programs.
It's sometimes handy to have a theoretical model at hand that can be used independently of a set of measured data. Reduced-order models can be quite useful.Crossover simulation programs use the measured impedance data directly, so there is no reason for a blocked impedance model.
That's absolutely correct. If you have measured the impedance of your driver in its enclosure then you have enough data to get an accurate crossover transfer function simulation working.Well, I can understand how Semi-Le would affect the impedance curve, but as I understand it, it's a constant vs. frequency, so the end result of Semi-Le on the impedance can be measured with a simple impedance sweep, therefore in the end I don't need Semi-Le by itself to get an accurate simulation of the crossover's transfer function, right?
This includes getting the phase response of the impedance correctly modelled, which is critical to crossover network design. The Semi-Le model is well suited to midrange drivers and tweeters and not just woofers.
Right, but unless I'm building an impedance model from manufacturer's advanced parameters (as ScanSpeak calls theirs) it would be unusual for me as a crossover designer to want to know these. I can imagine it would be helpful if I have no access to an actual driver or the impedance plots then sure, I can use these parameters to simulate the electrical behavior, output an impedance/phase plot and voila, I can make a crossover, or at least get started on an advanced Zobel circuit because I have all these extra parts I need to use.
🙂
Last edited:
An advanced impedance model is still needed to model LF accurately because the suspension compliance changes with frequency (this impedance model requires at least 3 impedance measurements with different added mass). And it is best if the parameters are measured on a broken in driver at similar levels the driver will be played, in order to account for the effect of amplitude on compliance. Hence the advice to use a small resistor value in the impedance measuring jig (comparable to the resistance of woofer inductors in a crossover).
This is the best working data extraction tool I have found, but it won't give you an accurate suspension model which requires 3 measurements, it will only help with seminductance.
https://www.graphreader.com/
This is the best working data extraction tool I have found, but it won't give you an accurate suspension model which requires 3 measurements, it will only help with seminductance.
https://www.graphreader.com/
A good paper on these effects from KEF.
https://www.klippel.de/fileadmin/kl...iterature/Papers/Voice_Coil__Impedance_04.pdf
https://www.klippel.de/fileadmin/kl...iterature/Papers/Voice_Coil__Impedance_04.pdf
Yes, that is most likely the cause. Without data < 20Hz i is difficult to determine Re' properly.Semi-Le_calc calculates a value of 7538 for Rss; that seems pretty high to me. Unfortunately, the values read in for the impedance curve only start at 20Hz; could that be a cause?
The driver is LaVoce SAF184.03, btw.
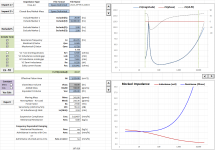
Here is my best estimate for the Semi-Le parameters, fixing Re' = 6.5, and using the datasheet value for Vas = 245 ltr.
Attachments
Thanks for the link to another plot data extraction tool. 🙂This is the best working data extraction tool I have found, but it won't give you an accurate suspension model which requires 3 measurements, it will only help with seminductance.
https://www.graphreader.com/
For those unfamiliar with the frequency dependent suspension model, Jeff Candy and Claus Futtrup describe the 3 measurement extraction method for the parameters in an AES paper:An advanced impedance model is still needed to model LF accurately because the suspension compliance changes with frequency (this impedance model requires at least 3 impedance measurements with different added mass)...
http://pietra-audio.com/images/jaes_preprint_deltamass.pdf )
and subsequent AudioXpress articles:
https://audioxpress.com/article/pro...box-simulation-with-speakerbench-part-1-model
https://audioxpress.com/article/pro...-speakerbench-part-2-introducing-speakerbench
They also developed an online utility called Speakerbench:https://www.diyaudio.com/community/threads/speakerbench.376463/post-6770090
While 3 measurements are required for an analytical solution of the frequency dependent suspension parameters, a very good approximation can be had using least-squares methods with just 2 measurements.
More details here: https://www.diyaudio.com/community...rporating-semi-inductance.329096/post-5964729
Le itself also changes drastically over stroke, especially if the driver has no shorting rings.An advanced impedance model is still needed to model LF accurately because the suspension compliance changes with frequency (this impedance model requires at least 3 impedance measurements with different added mass). And it is best if the parameters are measured on a broken in driver at similar levels the driver will be played, in order to account for the effect of amplitude on compliance. Hence the advice to use a small resistor value in the impedance measuring jig (comparable to the resistance of woofer inductors in a crossover).
This is the best working data extraction tool I have found, but it won't give you an accurate suspension model which requires 3 measurements, it will only help with seminductance.
https://www.graphreader.com/
One of the nice things about the semi-inductance model is that since we are modeling the physical reality of the lossy iron core, getting a match above 100Hz (where differences are larger) provides proper behavior below 100Hz where the increasing inductance with falling frequency is harder to decipher as it is contaminated by the motional impedance increment. Getting the correct ratio of resistance to inductance below 100Hz for the blocked impedance also allows extraction of more accurate mechanical model parameters since the skewing of the impedance peak is accounted for when determining Qes and Qms....It's odd then that it seems in the chart above that the largest effects Semi LE has on the impedance curve seem well above Fs.
More info here: https://www.diyaudio.com/community/threads/hornresp.119854/post-5420506
So, just because it's unusual for you doesn't mean that it isn't useful for someone else. Why try to lock them out of the equation?Right, but unless I'm building an impedance model from manufacturer's advanced parameters (as ScanSpeak calls theirs) it would be unusual for me as a crossover designer to want to know these.
Yes, that is most likely the cause. Without data < 20Hz i is difficult to determine Re' properly.
Here is my best estimate for the Semi-Le parameters, fixing Re' = 6.5, and using the datasheet value for Vas = 245 ltr.
I tried this myself according to your advice:
Both our values for Qes are a little bit off.
So which values to take? I'd keep the manufacturers values and just add the calculated semi-le-parameters to Hornresp? Which ones look better? 🙂
Btw. is there a way to spend you a coffee or beer; maybe via Paypal?
Your impedance curve fit appears to have some problems. The measured phase response looks quite odd to me, very much different from what a single resonance peak should produce. The impedance curve is also much steeper at 20Hz than I might have expected it to be. Just compare it to the results published by Lavoce, which are reproduced below, which is what I would expect.

Last edited:
@DerKalle Where did you obtain the impedance data from for the LaVoce SAF184.03?Semi-Le_calc calculates a value of 7538 for Rss; that seems pretty high to me. Unfortunately, the values read in for the impedance curve only start at 20Hz; could that be a cause?
The driver is LaVoce SAF184.03, btw.
I didn't measure anything; I just took the graph from LaVoce's homepage and used it. I don't know where semi-le_calc takes the phase response from...
I took the graph from LaVoce and used the SPLtrace-Tool from VituixCAD2@DerKalle Where did you obtain the impedance data from for the LaVoce SAF184.03?
You're right; my values are a bit off?! Impedance at resonance is higher than in the original graph. Perhaps I used logarithmic instead of linear scale or something; I'll have to check that and try again.
It produces the phase response as part of its impedance model. From an earlier post from bolserst, it appears that the curve fitting process doesn't use the phase response, as the supplied impedance data had a constant zero phase value. The fitted model, however, predicted the typical phase response of a woofer, so the results looked okay.I don't know where semi-le_calc takes the phase response from...
- Home
- Loudspeakers
- Multi-Way
- Thread for Drivers with Semi Inductance