I'm working on the processing. Functional in Octave and I'm trying to speed things up in python and am trying to use the gpu.
I'm trying to make the setup better with less devices scattered around, e.g. using a single power supply for the servos and amplifier. That would help in transportation and setup in a barn for quasi anechoic measurements.
I'm not making as much progress as I would like as other things take up some more time currently.
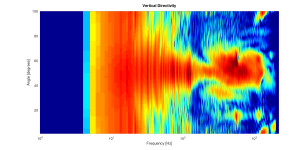
In principle I have the speaker response packed into a coefficients matrix, with SFS applied. You could say that's the virtual speaker and I can 'measure' anywhere I want (by evaluating the function). Here is an example:
The vertical directivity:

Sorry, I messed up the axis...
You can find a reference here:
https://www.audiosciencereview.com/forum/index.php?threads/elac-debut-2-0-b6-2-speaker-review.14272/
I'm trying to make the setup better with less devices scattered around, e.g. using a single power supply for the servos and amplifier. That would help in transportation and setup in a barn for quasi anechoic measurements.
I'm not making as much progress as I would like as other things take up some more time currently.
In principle I have the speaker response packed into a coefficients matrix, with SFS applied. You could say that's the virtual speaker and I can 'measure' anywhere I want (by evaluating the function). Here is an example:
The vertical directivity:

Sorry, I messed up the axis...
You can find a reference here:
https://www.audiosciencereview.com/forum/index.php?threads/elac-debut-2-0-b6-2-speaker-review.14272/
It would help greatly if the graphs had the same X and Y axis. Unless I am tired and overlooking something I don't see a truly comparable measurement between your impressive work, and the Klippel measurement that you cite on Audio Science.You could say that's the virtual speaker and I can 'measure' anywhere I want (by evaluating the function). Here is an example:
I tried to get the axis better aligned. I indicated some comparable features. I must admit one could easily find the same number of features that don't match. But for a first try in a very challenging room with no gating, I'm happy.

(reference from audiosciencereview, link in previous post)
(reference from audiosciencereview, link in previous post)
First. I am seriously impressed with the measurement that you made Tom. And I did see the similarities between your measurement and the Klippel version. They are so similar that my guess is that if you manage to duplicate the graph Axis Klippel displays the results on, they will be almost the same. So my comment was not in any way a criticism.
X and Y axis are the same. I tweaked the color axis for the 'best' match.
I am indeed to tired! I see it now. You have lined up the X axis well. And I am guessing the Y axis too. Klippel using more smoothing? I have always wondered how much smoothing is incorporated into the measurements.X and Y axis are the same. I tweaked the color axis for the 'best' match.
I've been traveling and had time taken up with other things, but I have to say, wow. I am seriously impressed @Tom Kamphuys, and it is tremendously encouraging to see those results!
I was planning on measuring the next speaker.

It's an ath (@mabat ) waveguide. I already started a measurement when it hit me (pun intended) that my motion planning and safety code assumed a rectangular speaker. So I will have to change that code (or better, extend the interface with a new implementation).

It's an ath (@mabat ) waveguide. I already started a measurement when it hit me (pun intended) that my motion planning and safety code assumed a rectangular speaker. So I will have to change that code (or better, extend the interface with a new implementation).
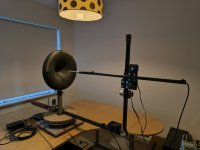
Here is a video the table top NFS being remotely controlled using a GUI:
I finally did the measurment (or roughly 90% of it). I changed the cylindrical control to spherical control. That means that the motions were according to the cylindrical measurement setup with only one stepper moving at a time, but for the spherical measurements the motion is also spherical. The radial and vertical steppers work together in such a way that they either perform an arc in the r-z plane or a (spherical) radial move. This automatically solves the possible collision with the speaker as all motion is over the same sphere as where the measurement points are on. Sounds like a simple idea, but I encountered countless (stupid) bugs in my code. I even bought another arduino to improve testing of the grbl part. Should have done that earlier...
On the positive side, the GUI is great. I start the application using my laptop and putty and then all you need is your phone to control scanner motion, set its zero point, take a single measurement to adjust the volume and start a measurement sequence.
The measurement itself needs some investigation. The waveguide is for 1kHz and up and the fit error is increasing rapidly and above 2kHz it is not good enough.
Looking at this I am very hopeful, and very, very grateful. I cannot begin to imagine how much time you have put into this project Tom.
Regarding the graph on ASR:

I am a bit confused as to the bumps centered at about 9.3 kilohertz. Is this a measurement anomaly or a computational anomaly?
Everything below 6.5 Kilohertz is as good as it gets. That is less than 0.5 db variation.
Last question, your mic offset. Was the horn under test centered on the mic? simply looking at your horn mount on the vertical post tells me that there was an offset. So you never truly had a 0 degree reference point.
Regarding the graph on ASR:
I am a bit confused as to the bumps centered at about 9.3 kilohertz. Is this a measurement anomaly or a computational anomaly?
Everything below 6.5 Kilohertz is as good as it gets. That is less than 0.5 db variation.
Last question, your mic offset. Was the horn under test centered on the mic? simply looking at your horn mount on the vertical post tells me that there was an offset. So you never truly had a 0 degree reference point.
The (computational) fit through the measurements is not good. I hope we can solve some with calibration of various aspect, some will probably stay because the room is very challenging. Klippel uses (additional?) gating for the frequencies; THe echo time is very small because of the desk the desktop NFS is on. I might be able to improve on that in this room. I (still) plan to do measurements in a barn to simplifiy the environments and isolate some errors. For higher frequencies, higher orders of the spherical harmonics are needed. It's a bit of a stretch, but you might call that a computational anomaly.I am a bit confused as to the bumps centered at about 9.3 kilohertz. Is this a measurement anomaly or a computational anomaly?
Work to be done on all fronts.
Well, with these 4 situations I cannot improve below 6.5kHz. In that sense it is as good as it gets, but it is not good enough and way worse than what Klippel claims.Everything below 6.5 Kilohertz is as good as it gets. That is less than 0.5 db variation.

I do not fully understand you. Could you channel some Deutsche Grundlichkeit in your writing? ;-)Last question, your mic offset. Was the horn under test centered on the mic? simply looking at your horn mount on the vertical post tells me that there was an offset. So you never truly had a 0 degree reference point.
Betrachten Sie das Bild:I do not fully understand you. Could you channel some Deutsche Grundlichkeit in your writing? ;-)
Ihr Mikrofon befindet sich nicht auf der Nullachse des Horns. Sie werden also nie eine Nullachsenmessung erhalten. Das heißt nicht, dass die Messungen wertlos sind. Es ist eine einfache Feststellung.
My German is much to rusty to type this out. Google Translate to the rescue. Maybe this is more sensible:
Your microphone is not on the zero axis of the horn. So you will never have a zero axis measurement. This is not saying that the measurements are without value. It is stating a simple observation.
My German is rusty too 🙂
This still does not put the mic on the zero axis of the horn, but at least gives me a (more) correct position of the mic.
I can, however, measure on the zero axis of the horn. I would have to rotate the mic (and thus the arm & boom), a different angle for eacht radius, but it could be done. But...
That is correct. The lower arm is besides the (stationary) center pole. Fortunately the motion system is not centered on the lower arm and the total off-center-ness is smaller than the ~2.5-3.0 cm because of the center pole. However, the mic boom is not fully parallel to the lower arm resulting in the image you included. Until now I just ignored all this and accepted the resulting errors. For the fit error graph you copied from ASR I introduced some correction that takes all this in account.Your microphone is not on the zero axis of the horn
This still does not put the mic on the zero axis of the horn, but at least gives me a (more) correct position of the mic.
I can, however, measure on the zero axis of the horn. I would have to rotate the mic (and thus the arm & boom), a different angle for eacht radius, but it could be done. But...
I'm generating a quite uniform set of measurement points on a sphere. This algorithm does not guarantee that I have any point on the zero axis. It is not necessary. We take enough measurements on two surfaces that enclose the speaker. That is enough. Then we end up with a matrix of coefficients that we can use to take virtual measurements where-ever we want by evaluating the fit. We can now take virtual measurements exactly on the zero axis.So you will never have a zero axis measurement. This is not saying that the measurements are without value. It is stating a simple observation.
Stab in the dark. Are you using phase to create the calculations? I remember bits of the math, and Fluids Nuclear orbitals. Should the -90 look a lot different? More or less mirrored?
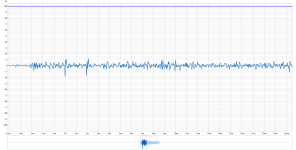
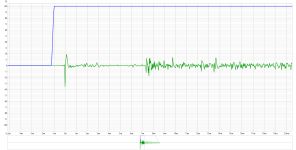
These are just the impulse responses.
I want to see the raw mic and amp signals (which are used to calculate the IR). Besides that I'm planning to test another amplifier where I can feed the output to the ADC. I remember clean measurements from that one.
Btw, I see this finding as progress. This shows a problem even before the SFS processing, so it makes finding the (a?) cause easier (wrt the fit error).
- Home
- Design & Build
- Software Tools
- Klippel Near Field Scanner on a Shoestring

