Went ahead and added a camilla_exit_cmd option to the alsa_cdsp plugin to run a command just before the camilladsp process is closed by the plugin. It is a handy point for saving gain and mute settings. Could also be used to save the entire live config camilladsp is using.

I got a report that wasapi exclusive mode refuses to work on one system, affecting all camilladsp versions from 0.6.3 to the latest rc. I have not been able to reproduce it, works ok for me. Has anyone else had any trouble?
FWIW, kernel 5.16 has made its way into Debian Bullseye Backports
Linux 5.16.0-0.bpo.3-amd64 #1 SMP PREEMPT Debian 5.16.11-1~bpo11+1 (2022-03-02) x86_64 GNU/Linux
Linux 5.16.0-0.bpo.3-amd64 #1 SMP PREEMPT Debian 5.16.11-1~bpo11+1 (2022-03-02) x86_64 GNU/Linux
- USB low-latency audio handling improvements.
- Intel AMX support
- performance improvements for SMB3/CIFS
- etc.
I compiled kernel 5.16.13 and installed it both on my laptop and my NUC a few hours ago. kernel timeslice is set to 4ms (250_HZ), just as in the generic ubuntu/mint kernel, in fact I used the generic mint kernel's config as a base for building.
First observation: the buffer underrun warnings when starting a new stream or when pulseaudio went into idle and deactivated the loopback device output are completely gone. So there must be something different in kernels > 5.14. Will leave music playing with amps off on the NUC and will report back how things are progressing...
First observation: the buffer underrun warnings when starting a new stream or when pulseaudio went into idle and deactivated the loopback device output are completely gone. So there must be something different in kernels > 5.14. Will leave music playing with amps off on the NUC and will report back how things are progressing...
How low can the latency become with recent linux distribution on a RPI 3 or 4 and a USB multichannel soundcard?FWIW, kernel 5.16 has made its way into Debian Bullseye Backports
Linux 5.16.0-0.bpo.3-amd64 #1 SMP PREEMPT Debian 5.16.11-1~bpo11+1 (2022-03-02) x86_64 GNU/Linux
- USB low-latency audio handling improvements.
- Intel AMX support
- performance improvements for SMB3/CIFS
- etc.
Say Camilla DSP 24db LR xovers and IIR filters and stable throughput.
Anyone who have tried to minimize latency and measured it?
Here are some older RaspPi4 latency numbers between the standard and PREEMPT_RT kernels.How low can the latency become with recent linux distribution on a RPI 3 or 4 and a USB multichannel soundcard?
Say Camilla DSP 24db LR xovers and IIR filters and stable throughput.
Anyone who have tried to minimize latency and measured it?
There has also been specific CamillaDSP RaspPi performance numbers posted here.
Pi Tests
Specific configuration latency numbers are dependent on the specific drivers being used.
#Raspberry Pi 4B: Real-Time System using Preempt-RT (kernel 4.19.y)
Last edited:
How low can the latency become with recent linux distribution on a RPI 3 or 4 and a USB multichannel soundcard?
Say Camilla DSP 24db LR xovers and IIR filters and stable throughput.
Anyone who have tried to minimize latency and measured it?
Here is a script that can test and plot your Linux system's latencies. You need to run it as root or sudo and will probably have to install some packages.
Changing the cyclictest parameter values can shorten/lengthen the sampling period to better catch intermittent latencies.
Code:
#!/bin/bash

echo Step 1 - cyclictest
# 1. Run cyclictest
#cyclictest -l100000000 -m -Sp90 -i200 -h400 -q >output
cyclictest -l1000000 -m -Sp90 -i200 -h400 -q >output

echo Step 2 - grep
# 2. Get maximum latency
max=`grep "Max Latencies" output | tr " " "\n" | sort -n | tail -1 | sed s/^0*//`

echo Step 3 - grep
# 3. Grep data lines, remove empty lines and create a common field separator
grep -v -e "^#" -e "^$" output | tr " " "\t" >histogram

echo Step 4 - set # of cores
# 4. Set the number of cores, for example
cores=4

echo Step 5 - for
# 5. Create two-column data sets with latency classes and frequency values for each core, for example
for i in `seq 1 $cores`
do
  column=`expr $i + 1`
  cut -f1,$column histogram >histogram$i
done

echo Step 6 - set and plot
# 6. Create plot command header
echo -n -e "set title \"Latency plot\"\n\
set terminal png\n\
set xlabel \"Latency (us), max $max us\"\n\
set logscale y\n\
set xrange [0:400]\n\
set yrange [0.8:*]\n\
set ylabel \"Number of latency samples\"\n\
set output \"plot.png\"\n\
plot " >plotcmd

echo Step 7 - for
# 7. Append plot command data references
for i in `seq 1 $cores`
do
  if test $i != 1
  then
    echo -n ", " >>plotcmd
  fi
  cpuno=`expr $i - 1`
  if test $cpuno -lt 10
  then
    title=" CPU$cpuno"
   else
    title="CPU$cpuno"
  fi
  echo -n "\"histogram$i\" using 1:2 title \"$title\" with histeps" >>plotcmd
done

echo Step 8 - gnuplot
# 8. Execute plot command
gnuplot -persist <plotcmd

echo Step 9 - done
Last edited:
FWIW, haven't run this in a while.
Here is 2 channel 192kHz content streamed over the web, sent to CamillaDSP, split into 8 output channels running 8 x 64-bit 256K tap FIRS on an old i7-3770K (@ 2012), resampled to 176.4kHz and set over USB to the DAC on the following kernel.
Linux 5.16.0-0.bpo.3-rt-amd64 #1 SMP PREEMPT_RT Debian 5.16.11-1~bpo11+1 (2022-03-02) x86_64 GNU/Linux
Multiple copies of multi-tab FireFox and multi-tab xcfe4 terminals are running in the background along over XRDP remote desktop.
Total system load is @ 5% CPU. I could never get this low of a latency on Windows with the same hardware.
Last edited:
Hi. I played with CamillaDSP (in moOde 7.6.1) for the first time yesterday and I think it's great - finally I can try other people's headphone presets (such as Oratory's) which contain filter types other than simple peak filters. I posted some feature suggestions in the moOde forum but was told this forum was a better location so I'll post them here. Perhaps they're sensible, or maybe someone know's why they're not, or if there's a work-around/explanation etc.
1) I like to max out the gain until I get clipping, then reduce it a little in case my test cases of "music likely to cause clipping" isn't perfect. CamillaDSP shows the number of clipped samples on the Pipeline editor page but once it's non-zero you have to remember what the number is as you flit between tracks. A little "reset clipped samples count" button would be great here.
2) I'm not sure of the interplay between the Configuration and Pipeline drop-down lists on the CamillaDSP Config page. Pipeline isn't always set to the currently selected preset when you arrive on this page. If you change the Pipeline one it resets the Configuration one to the currently selected (on another screen) one, but when you click on Open Pipeline editor at the bottom it's always working on the currently selected on, not whatever you've selected in Configuration and Pipeline. When you go back from the Pipeline editor view it's changed back, to neither the preset you've currently selected, not the one you set it to when you went into the Pipeline editor. Perhaps it should always get set to the currently selected preset, as it's fairly likely that after you've edited a pipeline you're going to want to download it somewhere for safety.
3) You can see a graph of individual filters but is there a way of seeing a graph of all of them combined over the whole frequency range?
Cheers and thanks for a great tool!
Hi. I played with CamillaDSP (in moOde 7.6.1) for the first time yesterday and I think it's great - finally I can try other people's headphone presets (such as Oratory's) which contain filter types other than simple peak filters. I posted some feature suggestions in the moOde forum but was told this forum was a better location so I'll post them here. Perhaps they're sensible, or maybe someone know's why they're not, or if there's a work-around/explanation etc.
1) I like to max out the gain until I get clipping, then reduce it a little in case my test cases of "music likely to cause clipping" isn't perfect. CamillaDSP shows the number of clipped samples on the Pipeline editor page but once it's non-zero you have to remember what the number is as you flit between tracks. A little "reset clipped samples count" button would be great here.
2) I'm not sure of the interplay between the Configuration and Pipeline drop-down lists on the CamillaDSP Config page. Pipeline isn't always set to the currently selected preset when you arrive on this page. If you change the Pipeline one it resets the Configuration one to the currently selected (on another screen) one, but when you click on Open Pipeline editor at the bottom it's always working on the currently selected on, not whatever you've selected in Configuration and Pipeline. When you go back from the Pipeline editor view it's changed back, to neither the preset you've currently selected, not the one you set it to when you went into the Pipeline editor. Perhaps it should always get set to the currently selected preset, as it's fairly likely that after you've edited a pipeline you're going to want to download it somewhere for safety.
3) You can see a graph of individual filters but is there a way of seeing a graph of all of them combined over the whole frequency range?
Cheers and thanks for a great tool!
1) I just restart the CamillaDSP service and the counter resets. Not sure how moOde differs here but imagine it resets on restart. I wouldn't mind a reset clipped samples button.
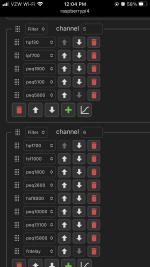
2) This is moOde specific and I agree it is confusing, not an issue with a vanilla CamillaDSP implementation where you are simply providing a configuration file which also defines a pipeline.
3) Pipeline will show combined filter response for each output by clicking plot button (same icon seen in Filter tab to plot individual filter response).
Michael
How about a display similar to system-load statistics? For example: "Clipped samples: 1/2/7", meaning 1 in the last 5 seconds, 2 in the last minute, 7 since reset.I wouldn't mind a reset clipped samples button.
1) I just restart the CamillaDSP service and the counter resets. Not sure how moOde differs here but imagine it resets on restart. I wouldn't mind a reset clipped samples button.
2) This is moOde specific and I agree it is confusing, not an issue with a vanilla CamillaDSP implementation where you are simply providing a configuration file which also defines a pipeline.
3) Pipeline will show combined filter response for each output by clicking plot button (same icon seen in Filter tab to plot individual filter response).
Michael
I agree about point 2.
Point 3 - thanks! I just noticed you are right but you have to combine all the filters into one step. I had a separate step for each filter plus one for the gain, per channel. Other than that I can now see the graph, which is the best approach?
As you note I use multiple filters in each step. Although I should mention that I also make gain and polarity adjustments in the Mixer and that is not reflected by the Pipeline plot. IMO CamillaDSP plotting is a nice quick visualization to see if the filters are working as expected but I always like to make a measurement of the DAC output with an ADC to truly confirm.
Michael
Michael
Attachments
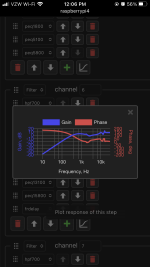
Ok.As you note I use multiple filters in each step. Although I should mention that I also make gain and polarity adjustments in the Mixer and that is not reflected by the Pipeline plot. IMO CamillaDSP plotting is a nice quick visualization to see if the filters are working as expected but I always like to make a measurement of the DAC output with an ADC to truly confirm.
Michael
Is there any reason, other than the ability to see plots, to pile all the filters into a single step vs having them all as separate steps? I don't see a performance difference when using top (but that's a bit of a blunt tool). Is there a sound quality - or any other - difference?
Putting all filters in the same step runs a tiny bit faster. It's so tiny I would say it's insignificant. But doing it also means you can plot them together, and the config gets shorter and easier to read.
Perfect - thanks. And thank you for your work on CamillaDSP!Putting all filters in the same step runs a tiny bit faster. It's so tiny I would say it's insignificant. But doing it also means you can plot them together, and the config gets shorter and easier to read.
Hi HenrikPutting all filters in the same step runs a tiny bit faster. It's so tiny I would say it's insignificant. But doing it also means you can plot them together, and the config gets shorter and easier to read.
Could you give us an example of a command line example of how to plot the filters that are port of a step ?
/Henrik
@HenrikEnquist
Are there any plans to turn the pipeline graph from read-only into something intereactive? It would be great to be able to drag the gain up/down and perhaps use the scroll-wheel to alter the Q value on the filters in the step, and hear the results more or less immediately (real-time or via an update button). Or is that a ton of work?
Are there any plans to turn the pipeline graph from read-only into something intereactive? It would be great to be able to drag the gain up/down and perhaps use the scroll-wheel to alter the Q value on the filters in the step, and hear the results more or less immediately (real-time or via an update button). Or is that a ton of work?
You can do it with the "plotcamillaconf" tool by just running "plotcamillaconf /path/to/some/config.yml"Hi Henrik
Could you give us an example of a command line example of how to plot the filters that are port of a step ?
/Henrik
This will plot the both the responses of each individual filter, and the combined responses of the filter steps. For a big config there will be a lot of plot windows 🙂
See also here: https://github.com/HEnquist/pycamilladsp-plot#plotting-a-configuration-from-the-command-line
- Home
- Source & Line
- PC Based
- CamillaDSP - Cross-platform IIR and FIR engine for crossovers, room correction etc