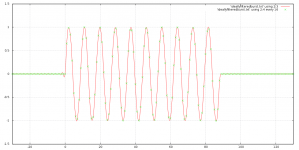
These transients are now visible above 17khz, at this point. With my story it is the frequency Phase splitter looks to be the one generating, as I get it on Hartley's modulator simulation.
On precedent post I showed how I can get excellent 20khz transient, but it was without quad phase shifter.
As I am able now to go up to 21khz, I will see what better I can get at lower ones.
Here is the response and the spectrum.


This was the 20khz Hartley without phase splitter, this means it is possible to have it without image and non resonant.
On precedent post I showed how I can get excellent 20khz transient, but it was without quad phase shifter.
As I am able now to go up to 21khz, I will see what better I can get at lower ones.
Here is the response and the spectrum.
This was the 20khz Hartley without phase splitter, this means it is possible to have it without image and non resonant.
Last edited:
Is your reconstructed waveform still equal to the samples at the sampling instants, or with a perfectly constant delay after the sampling instants? I remember you declared the samples holy earlier in this thread - no idea why, but you did.
This was the 20khz Hartley without phase splitter, this means it is possible to have it without image and non resonant.
Besides the question about the sample points, I wonder what the response at the end of a burst looks like.
The conventional way to get rid of pre-ringing is to make a minimum-phase rather than a linear-phase filter. You then get no pre-ringing, you do get post-ringing, the phase response becomes non-linear and you can't shift the samples on top of the reconstructed waveform anymore (actually that last comment also applies to many linear-phase filters). I'm wondering if you just found a very creative way to make a minimum-phase filter and if not, what the difference in behaviour is.
Interesting to show the FFT accuracy of LTSpice when going into more detail.Maybe you found out yourself in the meantime, but I suspect you offered a 1Volt peak 21.5Khz signal to your S&H.
The effective value is at -3dB, so when performing a FFT, you would get a peak at -3dB before multiplication with the sinc.
Hans
When offering a 1Vpeak sinewave at 21.5Khz, sampled at 44.1Khz in a 20msec window, the calculated 21.5K spectral peak should be at -6,719963554dB and for the 22.6K -7,153363138dB.
LTspice returns resp -6.695dB and -7.180dB, which is for both cases less then 0.03dB off, an excellent result IMO.
These figures were extracted after zooming into the FFT plot.
Hans
The sacred numbers not to be touched cannot apply for radio SSB technic for now, but bellow 10khz is is the case.
For the resonance of the QPS quadrant phase splitter is a aspect for me that as you mentioned about filter's phase shift, here the story is completely different.
I formulated the equation given in TI document
The graph of it
What intricate me is the linear phase shift. Solving for the phase I found it is equal to a constant 1/(2*fs) , That is 11us for the 44.1khz. By this the equation of a
sinc =Integral(sinwt-sinw(t-1/fs)) .
This is very strangely the formula of my delta-sigma.
I simulated it in LTspice and indeed I do get a sinc function with a constant delay of 11us. I 'll post it in few hours. You can see that sinc doesn't generate any images.
Tot straks.
This means all my measurements with FFT are wrong, good you warned me.Interesting to show the FFT accuracy of LTSpice when going into more detail.
When offering a 1Vpeak sinewave at 21.5Khz, sampled at 44.1Khz in a 20msec window, the calculated 21.5K spectral peak should be at -6,719963554dB and for the 22.6K -7,153363138dB.
LTspice returns resp -6.695dB and -7.180dB, which is for both cases less then 0.03dB off, an excellent result IMO.
These figures were extracted after zooming into the FFT plot.
Hans

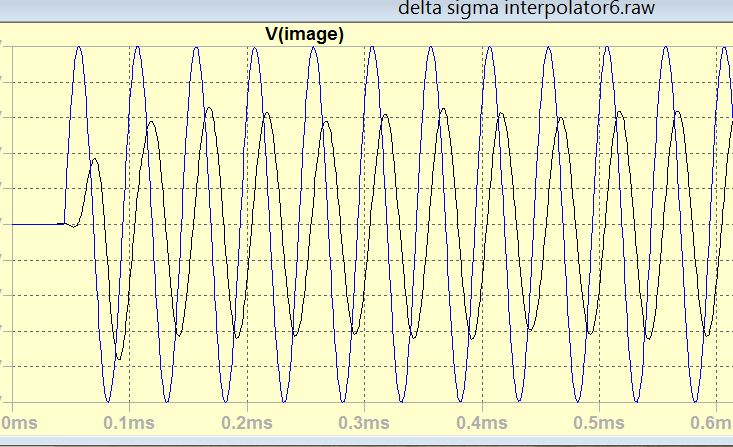
This is the analog sinc or my delta-sigma.
This is the bode plot of the circuit along half delay.

To show how it remains at constant delay here is relative phase of sinc to half delay at 1khz and 20khz


As can be seen the 20khz doesn't get modulated just by sinc function.
This means my DAC has sinc² function with -6.2db at 20khz.
This refers to your linear interpolator, doesn't it?
When you draw the impulse response of a linear interpolator and then calculate the convolution of two rectangular pulses of one sample period wide, you will see that they are exactly the same: triangles of two sample pulses wide with the peak in the middle. Hence, one linear interpolator is equivalent to a cascade of two filters with uniform weighting over one sample period.
A filter with uniform weighting over one sample period has a sinc-shaped amplitude versus frequency response, so a linear interpolator indeed has a sinc² shaped amplitude versus frequency response.
You can see that sinc doesn't generate any images.
It's not clear to me what you mean by this. According to Shannon, you can completely suppress images with a filter with a sinc-shaped impulse response, not with a sinc-shaped frequency response.
Hayk,
I always appreciate the intellectual challenges that you are trying to conquer a lot, but do you also want to come with a practical design in this specific case?
Have you taken notice of the way that Accuphase uses by taking 8 NOS Dacs, all processing the same data but delivering their output shifted 1/(fs*8) in time.
This also performs as a linear interpolator with a sinc^2 envelope.
Hans
I didn't knew about Accuphase, I also had this idea of having multiple dacs in sequential.

from abraxalito's Ling dac.
This generates linear interpolation, passing from the two levels in multiple steps, also averages the linearity of the dacs.
from abraxalito's Ling dac.
This generates linear interpolation, passing from the two levels in multiple steps, also averages the linearity of the dacs.
It's often used with single-bit DACs, see the DCS1 and DCS2 threads and Heinrich Pfeifer, Werner Reich and Ulrich Theus, Circuit arrangements for averaging signals during pulse-density D/A or A/D conversion, US patent 4947171, 7 August 1990. When you take a weighted sum, you can make any finite impulse response you like.
Marcel, you remind me yesterday about sacred numbers, it gave me the idea to overlook this problem above 10khz differently. First I switched to Tina, as Hans showed the FFT viewer of LTspice is not as practical as of Tina. If I consider that I have 2-3 sacred points to recreate my signal back by interpolation, I also see in this black box entering the Nyquist frequency also to take part of reconstruction.
Now I understood the sinc mechanism, I will investigate that of the modulation that is forgotten. So I put aside the SSB and see how the interpolation by using the Nyquist should take part.
Now I understood the sinc mechanism, I will investigate that of the modulation that is forgotten. So I put aside the SSB and see how the interpolation by using the Nyquist should take part.
I am thinking about modulation/demodulation. If modulation consist of multipkication, no doubt the demodulation is division.
On Tina I tried out am modulation and demodulate by division, it works very well, the two side bands transform back to modulating signal. With DAC, AM modulation is not straight forward as is the case for demodulation. Now all I need with what factor I should for division.
On Tina I tried out am modulation and demodulate by division, it works very well, the two side bands transform back to modulating signal. With DAC, AM modulation is not straight forward as is the case for demodulation. Now all I need with what factor I should for division.
If modulation is multiplication, then is digitization a voltage level multiplied by a sample period? If so, is the result in units of volt-seconds?
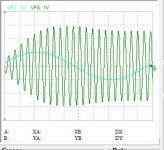
This is an example of multiplication.

The clock Nyquist, yellow, is multiplying the delta (difference between two samples) grey , the result in blue, is the envelope which is the beat of our signal and its image.
Here the clock in time domain, multiplies with +/-1v so it is follower or inverter.
In frequency domain, the story is different. The two modulated frequencies our signal and the image, by multiplication they got united back . To note that there is no any filtering.
traces are offseted for clear view.
- Home
- Source & Line
- Digital Line Level
- Analog Delta-Sigma interpolation DAC