Filters should be offset to help with phase and response.
It has worked well for me in some personal experiments, do not have any articles I can refer to.
It has worked well for me in some personal experiments, do not have any articles I can refer to.
Filters should be offset to help with phase and response.
It has worked well for me in some personal experiments, do not have any articles I can refer to.
Kaffimann, I will look to your proposal.
It should be nice at this moment if some xo try outs could be made on a digital platform first. Especially before ordering and making a first passive version.
Matthias, not any possibilty to do that?
At this moment I am using a miniDSP to try out different xo versions on my own speaker. In my case it will become a digital version as the final version, but the listening tests on the different xo versions are very learnful.
It is just an idea.
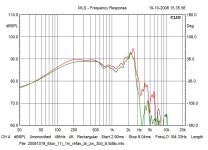
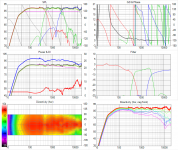
I have some older measurements that were done in a professional anechoic room of a 11 inch Eton in a basreflex cabinet. The cabinet was 50 cm wide. Only on axis and 30 deg off axis horizontal were measured at that time. I compared these measurements with the simulations I did in Leap.
In the plot the measurements in color and the simulations in grey. Just to show that the Leap simulation was very close to the measurement.
Thinking about the differences I see now with the Monkey box and the simulations, see post 560, the woofer piston diameter is close to the front baffle width. Maybe the Leap simulator has some problems with that. That is the only explanation I have for the differences between off axis measurements and simulations. But I can hardly believe that it is the reason.
I will do some indoor and outdoor measurements of my own speaker soon also. That is a 36 cm wide speaker with an 11 nch woofer, alsmost simular with the Monkey Box concept. I am curiuos what those results will be.
Isn't it better to focus now on the xo design and wait for some more certainty about the accuracy of the off axis measurements?
Attachments
Last edited:
Byrt:
it is not clear for me, what exactly did you change in the right six pack plots w.r.t. to left ones. And which seven off axis repsonses are you talking about, the measured ones by Mattias or some spliced ones. Maybe I have missed something, because I didn't analyse the previous posts in detail, sorry for that.
Its the left six pack plots that has the on axis curve mainpulated with a transfer funhtion so that on axis slope is nearly the text book target slope you show us into post 515 and it should be clear if you look at upper left plot between the two six packs. My comment about numbers of off axis curve was noncense and sorry for that, it should read that off axis curves is accurate the same 12 as used for the other six pack of plots you know 6 for left and 6 for right side. That research was to see how power reponse would react but it didn't change much and think your research below is probably some of the culprit also resolution between on axis verse all the off axis is different and probably not the best thing, say this because later i also tried add same transfer funchtion to off axis curves and that show wrong picture because on axis verse of axis curves are different in resolution. BTW transfer funchtion used for the three on axis passbands to get near textbook target cascaded the electric XO network is below and should you like them as frd files i can share them.
I have done an off axis simulation in Leap to compare with the indoor measurements of Matthias.
There is a large difference between the simulation and the measurements.
In the plot the SPL off axis of the Faital 12PR320 0 - 30 - 60 deg on - off axis. Measurements in color, simulations in black.
I dont't understand it. I have some older off axis measurements of an 11 inch in a cabinet, done in a professional anechoic room. I will have a look at those also.
Remark that ka = 1 at 439 Hz for the used 12 inch woofer.
As an information, this is the transition frequency between non-directional and directional radiation (on infinite baffle).
I will investigate this, we have to be sure which are correct off axis curves if an off axis study of the woofer is wanted...
Think you into something there, guess for woofer we could maybe use simulation based on piston diameter and get closer to some degree but it wouldn't work for the the other two using wave guides.
Attachments
I think it will work quite well, but do not take my specific suggestion as gospel.
It is just that using different order xo for HP/LP have been mentioned in some rare sentences, and used in some successful professional designs, after testing it myself I think it has some benefits to equal order filters, and especially when you have different roll off characteristics on the drivers.
It is only briefly mentioned on Wikipedia:
Audio crossover - WikipediaMixed order
Crossovers can also be constructed with mixed order filters. For example, a second order lowpass combined with a third order highpass. These are generally passive and are used for several reasons, often when the component values are found by computer program optimization. A higher order tweeter crossover can sometimes help compensate for the time offset between the woofer and tweeter, caused by non aligned acoustic centre
Matthias:
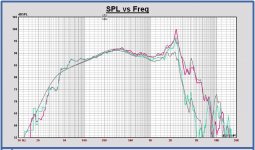
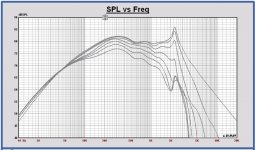
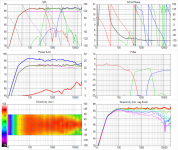
Look to a Clio outdoor measurement on axis and 30 degrees off axis, I did in the past of the same speaker I also measured in the anechoic room (post 563). The gate time is set to 5ms in that Clio measurement (settings below the graph). These measurements become close to the anechoic measurements above 500 Hz.
Seeing all these results, I don't understand the results of your off axis measurements. Are you sure of your measurement settings?
Attachments
I have done an off axis simulation in Leap to compare with the indoor measurements of Matthias.
There is a large difference between the simulation and the measurements.
In the plot the SPL off axis of the Faital 12PR320 0 - 30 - 60 deg on - off axis. Measurements in color, simulations in black.
I dont't understand it. ...
Remark that ka = 1 at 439 Hz for the used 12 inch woofer.
This does look strange indeed. Is it possible the outer parts of the Faital cone tend to "shut off" at higher frequencies, resulting in a smaller effective cone diameter?
I spent some time working to combine the on-axis outdoor measurement, the indoor measurements (on-axis and off-axis), the modelled/spliced low-frequency parts of the curves in post 511, and the Vituix modelled directivity index for the low-frequency part. I believe the picture I had on my screen was just the other way round... the Vituix model predicts more directivity than my indoor off-axis measurements. I'll take a closer look at this again, and come back with this once things are cleaned up.
...if some xo try outs could be made on a digital platform first. Especially before ordering and making a first passive version.
Matthias, not any possibilty to do that?
I do have a MiniDSP somewhere, need to look for it. I never really got the hang out of it, partly because the software requires a Mac or Windoze machine (I moved to Linux a while ago). I guess the software issue could be solved somehow, and if someone around here is good with the biquad stuff, the MiniDSP would be useful. Oh, and I'd need some amplifiers to run the Monkey Coffin in an active setup...
Isn't it better to focus now on the xo design and wait for some more certainty about the accuracy of the off axis measurements?
Sure! I just want to make sure we have good on-axis and off-axis data to take a good look at the x-over design. Vituix really seems to be very useful for that, because you immediately see how the on-axis and off-axis behaviour of the design changes when you're tweaking the x-over filter. That's why I am workin on compiling consistent on-axis and off-axis data.
Matthias:
Look to a Clio outdoor measurement on axis and 30 degrees off axis, I did in the past of the same speaker I also measured in the anechoic room (post 563). The gate time is set to 5ms in that Clio measurement (settings below the graph). These measurements become close to the anechoic measurements above 500 Hz.
These curves are almost parallel up to about 3.3 kHz. Isn't that a bit unexpected given the ka argument you gave above (should get directional below 1 kHz). Also, if the anechoic part / gate time is 5 ms, the data would be anechoic down to 200 Hz. And there should be no data below 200 Hz, but the curves go down to 20 Hz. This looks a bit awkward to me.
It's always possible that I screwed up my indoor off-axis measurement somehow. However, I repeated some of these measurements a few days later, just to check (and they were consistent). Also, the on-axis measurements I made indoors and outdoors are nicely consistent > 300 Hz (where both are anechoic). The indoor on-axis measurement was just one of the many measurements I made during the series all dispersion measurements. I don't see any reason for a messed up measurement set up. In any case, I will check again some time during the next few days.
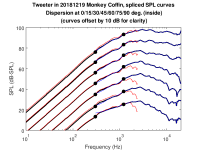
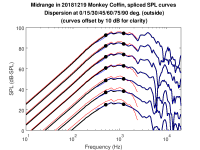
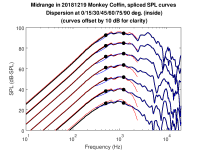
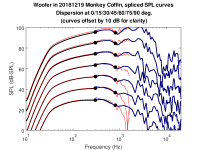
Following up on my thoughs in post 555, here's my attempt to produce a complee data set of SPL curves from 20 Hz to 20 kHz at horizontal angles from -90° to +90° at 15° steps. The goal is to obtain consistent data for use in modelling software.
Here's a step-by-step description of what I did:
(A) The indoor measurements at horizontal angles from -90° to +90° (15° steps) were used at frequencies from about 500 Hz or 1 kHz and up. These curves were measured indoors and therefore allow anechoic SPL curves down to about 300 Hz only. Also, the FFT resolution is rather low for modelling purposes below 1 kHz or so.
(B) The low-frequency parts of the SPL curves from post 511 were used to define the on-axis response below about 500 Hz to 1 kHz. The off-axis response in this low-frequency range was estimated from the on-axis curves using the directivity index curves determined from the Vituix diffraction calculator as described in post 555.
(C) The high-frequency parts from step (A) were spliced to the low-frequency parts from step (B) to obtain SPL curves spanning the entire frequency range and horizontal angles. The curves were spliced with MATAA using a "soft merge", as shown in the attached plots (red: low frequency part, blue: high frequency part, black: spliced curves, black dots indicate the "soft merge" range).
(D) Minimum phase was determined from the spliced SPL magnitude curves.
(E) Data was exported to FRD data files for use with modelling software.
Let me know what you think about this procedure. I can still implement (minor) changes, as the whole procedure is implemented in an "automated" Octave script, so it's easy to repeat. I think the resulting data are nicely consistent and allow much better comparison and modelling of the on-axis and off-axis behaviour.
Attachments

It should be nice to have a miniDSP setup. Then it is possible to make already the current EL3 xo version without any invest in components. And try other proposals like the one of Kaffimann, all with less of effort, just installing the miniDSP 🙂.
I have a good experience with programming the biquads and can deliver the configuration files ready to synchronize with the miniDSP. I am currently using miniDSP for my own speaker.
And you can try out a 5th order elliptical filter, just to listen to it. I use it myself now, for me the best of the best 🙂. Personal opinion.
I will look also to Vituix later.
The 30 degrees SPL for that speaker is correct, measured like that in the anechoic room and with my Clio outdoors. I just wanted to say that Leap simulates it conform these measurements and not with the Monkey Box.
The measured woofer is the Eton 11-581, it has a rather flat cone, not a deep one.
I think that Clio applies some interpolation on the measured data. The extension to 20 Hz, I don't understand.
I have a good experience with programming the biquads and can deliver the configuration files ready to synchronize with the miniDSP. I am currently using miniDSP for my own speaker.
And you can try out a 5th order elliptical filter, just to listen to it. I use it myself now, for me the best of the best 🙂. Personal opinion.
I will look also to Vituix later.
These curves are almost parallel up to about 3.3 kHz. Isn't that a bit unexpected given the ka argument you gave above (should get directional below 1 kHz). Also, if the anechoic part / gate time is 5 ms, the data would be anechoic down to 200 Hz. And there should be no data below 200 Hz, but the curves go down to 20 Hz. This looks a bit awkward to me.
The 30 degrees SPL for that speaker is correct, measured like that in the anechoic room and with my Clio outdoors. I just wanted to say that Leap simulates it conform these measurements and not with the Monkey Box.
The measured woofer is the Eton 11-581, it has a rather flat cone, not a deep one.
I think that Clio applies some interpolation on the measured data. The extension to 20 Hz, I don't understand.
Last edited:
Matthias, at very low frequencies like 20 Hz your speaker is omnidirectional, so no attenuation off axis.
So, the off axis responses of your last post cannot be correct.
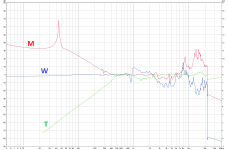
Edit: in the plot a typical horizontal off axis response of a woofer in a cabinet
So, the off axis responses of your last post cannot be correct.
Edit: in the plot a typical horizontal off axis response of a woofer in a cabinet
Attachments
Last edited:
...*sigh* I will have to look into Vituix then, have not gotten around to it, even though I am donating a tiny sum regularly. Can I just import the FRD files and it's all good to go?
In post 544 see hanged on project folder for VituixCAD so far, then build upon that with "save as" when off axis curves or whatever is improved down the road.
...Let me know what you think about this procedure...
A first look comment is not about procedure but can see for whatever the reason is that resolution looks better than the off axis curves from your website project page zip folder, should look clear in below comparison where we see off axis looks smoothed or use FDW than Paul's on axis curves from post 511.
Attachments

Matthias, at very low frequencies like 20 Hz your speaker is omnidirectional, so no attenuation off axis.
So, the off axis responses of your last post cannot be correct.
My plots are pretty much in line with the expected omnidirectional behaviour. Note that the curves are artificially offset by 10 dB from each other just to make the plots clearer (as noted on the diagrams).
A first look comment is not about procedure but can see for whatever the reason is that resolution looks better than the off axis curves from your website project page zip folder, should look clear in below comparison where we see off axis looks smoothed or use FDW than Paul's on axis curves from post 511.
This is simply because the data used for the curves in post 511 had a lot of smoothing. I used much less smoothing in post 568.
Oops, I was a little bit too fast with my comment, sorry.My plots are pretty much in line with the expected omnidirectional behaviour. Note that the curves are artificially offset by 10 dB from each other just to make the plots clearer (as noted on the diagrams).
The procedure is ok. It is the same as we have done for the on axis curve, but using the Leap low frequency simulator in that case... if I have understood it well this time...
Matthias,
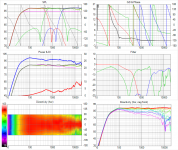
Traced your post 568 curves although your originals should be better than traced images but below is what i get.
First is before, second is the new ones where power response dip for 500Hz XO point improve alot and power response peak about 2800Hz plus its weaker directivity index is still there, third is same as second but using a transfer funchtion so as slopes get nearly a text book target this seems improve power response peak about 2800Hz plus its weaker directivity index there but will probably need powerfull DSP engine to get so smooth a response.
Attachments
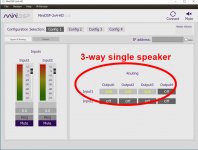
I found my miniDSP. It's a 2x4 HD unit. I should also have some amplifiers to set up a 3-way active system for testing.
Is it possible to set the miniDSP up to use 1 input and 3 outputs for the woofer, mid, and tweeter? If so, how do I implement Pauls EL3 filter to get this going?
Is it possible to set the miniDSP up to use 1 input and 3 outputs for the woofer, mid, and tweeter? If so, how do I implement Pauls EL3 filter to get this going?
Byrtt,
Your third simulation version looks a little irrealistic, looking to the filter transfer of the midrange at low frequencies.
How this optimizing transfer is done, by a kind of optimizer in Vituix?
Your third simulation version looks a little irrealistic, looking to the filter transfer of the midrange at low frequencies.
How this optimizing transfer is done, by a kind of optimizer in Vituix?
Yes, you must use the right application for the unit.
Looking at simulations, directivity below 800Hz in second and third version looks too high for this kind of speaker/drivers. Was speaker-mic distance constant when doing off-axis measurements of bass driver? If you just move mic sideways, distance grows and signal attenuates. Speaker/mic distance to wall variation can cause the error too.
Looking at simulations, directivity below 800Hz in second and third version looks too high for this kind of speaker/drivers. Was speaker-mic distance constant when doing off-axis measurements of bass driver? If you just move mic sideways, distance grows and signal attenuates. Speaker/mic distance to wall variation can cause the error too.
Attachments
Last edited:
Yes, you must use the right application for the unit.
Ok, found the software, got it working on virtual machine, convinced computer to route USB to virtual machine, convinced Windoze to swallow the miniDSP driver, and voila: connected to the miniDSP and set it to 1-input / 3-output as shown in your attachment. Now how do I tell it to use Pauls EL3 filter?
Looking at simulations, directivity below 800Hz in second and third version looks too high for this kind of speaker/drivers. Was speaker-mic distance constant when doing off-axis measurements of bass driver?
Yes. I just rotated the speaker around the center line of the baffle. Just to be sure: did you realize that my plots have additional 10 dB offsets between the curves? I did that in the plots to make it easier to see the individual curves, it's not really in the data!
- Home
- Loudspeakers
- Multi-Way
- Open Source Monkey Box