So the impulse duration is also only 3 ms, available for FFT. I don't use any of the echoic part 🙂.
Hmm, but how does Leap get data at frequencies below 1/3ms = 333 Hz then? Take a look at the blue line in the Leap plot attached to your post 452, where the FFT extends to below 200 Hz. This implies a gate time of more than 1/200Hz = 5 ms.
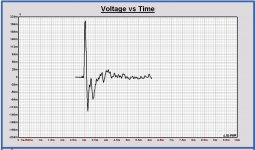
Look how my impulse looks in Leap.
I cannot find yet how the FFT window is applied.
I suppose Leap will do FFT from 0 to 6 ms, assuming voltage is zero before impulse start, but not sure of this.
I find: Leap uses 155 points of the impulse data or a window of 3.5 ms.
I cannot find yet how the FFT window is applied.
I suppose Leap will do FFT from 0 to 6 ms, assuming voltage is zero before impulse start, but not sure of this.
I find: Leap uses 155 points of the impulse data or a window of 3.5 ms.
Attachments
Last edited:
I suppose Leap will do FFT from 0 to 6 ms, assuming voltage is zero before impulse start
That would fit the lower frequency limit of 1/6ms = 167 Hz in the plot. Seems like cheating to me.
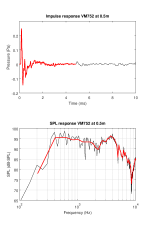
I did a quick impulse response measurement at 0.5m distance. Results are attached (no smoothing applied). With a bit of luck, that's good enough to get the splicing going. Red: anechoic (down to 205 Hz), black: with echoes (20ms gate time, just out of curiosity)
Attachments
Last edited:
50 cm measurement is a little different ... black is Leap simulation
I guess the black curve is the Leap model for 1m, right? If Leap models the curve at 50cm similar to the measured 50cm curve I guess that should work as an argument that the Leap model is okay, and I'd be happy to extrapolate it to 1m.
Here the Leap sims at 50 cm.
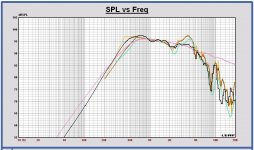
Out of experience I know that in Leap bafflestep boost is lower and at very low frequencies SPL 1 dB higher (with this driver in this cab).
In first plot:
- Leap 50 cm in cabinet scaled to 1m (black)
- Leap 50 cm on infinite baffle scaled to 1m (pink)
- measurement 50 cm unsmoothed (yellow)
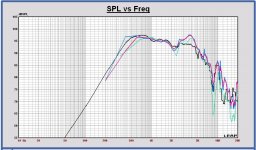
In second plot:
- measurement 50 cm smoothed 1/12 octave added (brown)
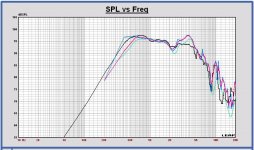
In third plot:
- measurement 100 cm smoothed by Matthias added (green)
You can see what the large effect of smoothing is below 1kHz.
Therefore, can you post the unsmoothed 1 m measurement also?
Also to compare again with the Leap sim.
The SPL difference between 2 and 6 kHz is too large at 50 cm versus 100 cm.
I think we are coming close to the finish pfff )
Out of experience I know that in Leap bafflestep boost is lower and at very low frequencies SPL 1 dB higher (with this driver in this cab).
In first plot:
- Leap 50 cm in cabinet scaled to 1m (black)
- Leap 50 cm on infinite baffle scaled to 1m (pink)
- measurement 50 cm unsmoothed (yellow)
In second plot:
- measurement 50 cm smoothed 1/12 octave added (brown)
In third plot:
- measurement 100 cm smoothed by Matthias added (green)
You can see what the large effect of smoothing is below 1kHz.
Therefore, can you post the unsmoothed 1 m measurement also?
Also to compare again with the Leap sim.
The SPL difference between 2 and 6 kHz is too large at 50 cm versus 100 cm.
I think we are coming close to the finish pfff )
Attachments

Last edited:
You can see what the large effect of smoothing is below 1kHz.
Therefore, can you post the unsmoothed 1 m measurement also?
Here you go.
Attachments
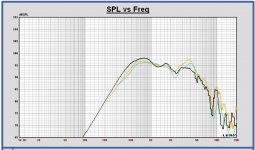
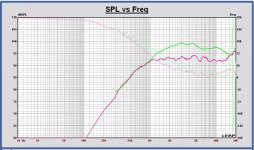
Here the plots of Volt VM752 in Monkey Box:
- 50 cm measured unsmoothed (blue)
- 50 cm measured smoothed 1/12 octave (red)
- 1 m measured unsmoothed (green)
- Leap sim using 50 cm SPL and scaled.
smoothing 1/12 octave on 1 m response has no infleunce on SPL
My proposal is to splice at 900 Hz and using 1m response, becasue of the SPL difference between 2k and 6k. And not lower than 900 Hz, because of the very poor frequency resolution. You can see now with the unsmoothed versions.
Later on, mayby trying to do a measurement with longer gate time in some way to check.
For woofer and tweeter can I have the anechoic unsmoothed SPL's also?
It is better to stay with MATAA FFT now.
I hope to finalize all splicing soon now, that we can start with xo 🙂.
Attachments
In attach amplitude and phase curves for data splicing of woofer and tweeter, red is simulation and green the measurements by Matthias.
Woofer to be data spliced at 950 or 380 Hz, tweeter at 340 Hz. Tweeter simulation without waveguide.
Merry Christmas to all!
Woofer to be data spliced at 950 or 380 Hz, tweeter at 340 Hz. Tweeter simulation without waveguide.
Merry Christmas to all!
Attachments

Paul, you're doing such great work here! Thank you!
However, it seems my work was not so great. I made a stupid mistake... sometime during the past few days I did an impedance measurement and connected everything to my impedance jig. And I didn't disconnect it when I went back to the acoustic measurements for the Volt, so the dummy load was always in between the VM752 and the amplifier. That explains why the more recent measurements gave so much higher SPL around the impedance peak of the VM752. Damn! I should have realised this right away when the 0.5m measurement was more or less at the same SPL level as the 1m measurement...
Paul, I guess the comparison of the modeling data with my measurements needs to be repeated... I took some new measurements today, and I hope they work as good X-Mas present (data in attachment; black: nearfield, red: 25cm, blue: 50cm, pink: 100cm).
Sorry for this!!!
Merry X-Mas to all of you!
Attachments

Hi Matthias,
Thanks, you are very welcome, I like to do this project. I learn of it a lot again and we all know you are putting all your efforts in it in the best way, that makes it very nice to do it all.
And if there are made mistakes sometimes, that is a part of the job. The same counts for statements we are making that can be wrong sometimes, we learn out of it and no problem at all.
I had already a fast look at the curves. Also the nearfiel is ok now, fitting perfect on my infinite baffle simulation🙂. Great.
And it looks there is no bafflestep boost with this dome on this baffle.
More about it later.
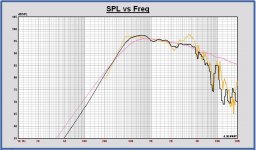
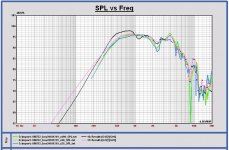
Some comparing plots with the last Volt VM752 measurements of Matthias.
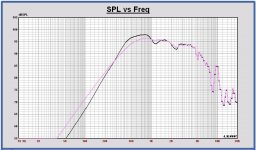
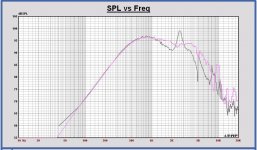
Plot 1: Nearfield measurement (grey) and simulated infinite baffle response (calculated with TSP) (pink). Good fit. Infinite baffe model is ok.
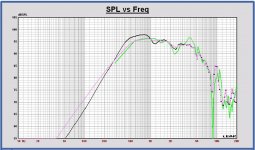
Plot 2: infinite baffle response (pink) and simulated 1m response in cabinet (black)
Plot 3: 1m measurement in cabinet added (green)
Plot 4: 50 cm (yellow) and 25 cm (blue) measurement in cabinet, scaled to 1m, added
It looks like the measurement is correct and the simulation wrong, which means there is no bafflestep boost with this dome midrange.
Maybe we can start with splicing the 1m measurement and simulation at 300 Hz and do some curve editing between 100 and 300 Hz to eliminate the bafflestep boost of the simulation.
And checking the measurement later with longer FFT gate time.
Plot 1: Nearfield measurement (grey) and simulated infinite baffle response (calculated with TSP) (pink). Good fit. Infinite baffe model is ok.
Plot 2: infinite baffle response (pink) and simulated 1m response in cabinet (black)
Plot 3: 1m measurement in cabinet added (green)
Plot 4: 50 cm (yellow) and 25 cm (blue) measurement in cabinet, scaled to 1m, added
It looks like the measurement is correct and the simulation wrong, which means there is no bafflestep boost with this dome midrange.
Maybe we can start with splicing the 1m measurement and simulation at 300 Hz and do some curve editing between 100 and 300 Hz to eliminate the bafflestep boost of the simulation.
And checking the measurement later with longer FFT gate time.
Attachments
-
 Volt VM752 MonkeyB x100-50-25 SPL - Leap cabinet 1m - Leap infbaf.JPG161.5 KB · Views: 348
 -
 Volt VM752 MonkeyB x100 SPL - Leap cabinet 1m - Leap infbaf.JPG149.9 KB · Views: 363
 -
 Volt VM752 MonkeyB Leap cabinet 1m - Leap infbaf.JPG148 KB · Views: 355
 -
 Volt VM752 MonkeyB x0 SPL - Leap infbaf.JPG143.8 KB · Views: 364
Last edited:
...we can start with splicing the 1m measurement and simulation at 300 Hz and do some curve editing between 100 and 300 Hz to eliminate the bafflestep boost of the simulation.
And checking the measurement later with longer FFT gate time.
Sounds good! The xover development will be an interesting process!
Is there a measured tweeter impedance also? I don't remember if one has been posted.
Just to check with tweeter model and add it to a final set of frd's for xo.
Just to check with tweeter model and add it to a final set of frd's for xo.
Is there a measured tweeter impedance also? I don't remember if one has been posted.
Here you go.
Attachments
Thanks Matthias.
What is the idea about the splicing frequencies of woofer and tweeter in my post #470?
I think woofer splicing at 950Hz? Which means using bafflestep of simulation.
Tweeter at 340 Hz looks ok.
What is the idea about the splicing frequencies of woofer and tweeter in my post #470?
I think woofer splicing at 950Hz? Which means using bafflestep of simulation.
Tweeter at 340 Hz looks ok.
I think woofer splicing at 950Hz? Which means using bafflestep of simulation.
Why not. Woofer baffle step model should be more "mainstream" than with the large dome+waveguide.
Last edited:
Here the frd files of woofer Faital Pro 12PR320, midrange Volt VM752 and tweeter Scanspeak R2904 + WG148 for the Monkey Box.
SPL at 1m, 2.83Vrms, each driver on its own axis.
Spliced data, simulation for low frequencies and measurement for high frequencies.
Splicing frequency woofer: 1000 Hz
Splicing frequency midrange: 280 Hz
Splicing frequency tweeter: 300 Hz
Impedance responses are the measurements of Matthias.
Acoustic center of tweeter is 10 mm behind the acoustic center of midrange.
Acoustic center of woofer is 39 mm behind the acosutic center of midrange.
Conform measurement Matthias.
In attach the frd's of the individual SPL and impedance responses of the drivers.
Matthias:
maybe a fast check of the data?
SPL and impedance plots in next post.
xo design can be started 🙂
Attachments
-
ScanR2904+WG148 MonkeyBox Impedance.txt3.2 KB · Views: 131
-
ScanR2904+WG148 MonkeyBox SPL 1m 0deg 2.83V full space.txt23.7 KB · Views: 98
-
Volt VM752 MonkeyBox Impedance.txt24.4 KB · Views: 99
-
Volt VM752 MonkeyBox SPL 1m 0deg 2.83V full space.txt19.6 KB · Views: 97
-
Faital Pro 12PR320 MonkeyBox Impedance.txt72.3 KB · Views: 142
-
Faital Pro 12PR320 MonkeyBox SPL 1m 0deg 2.83V full space.txt22.7 KB · Views: 109
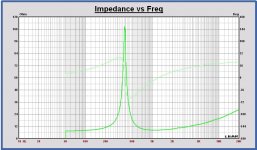
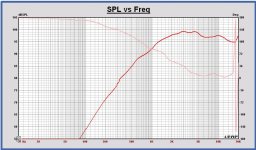
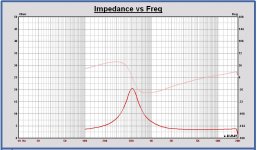
SPL and Impedance plots of the individual drivers as decribed in previous post 479
Attachments
-
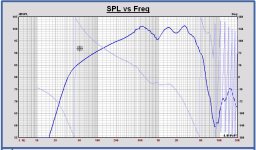 Faital Pro 12PR320 MonkeyB SPL 1m 0deg 2.83V full space.JPG154.1 KB · Views: 146
 -
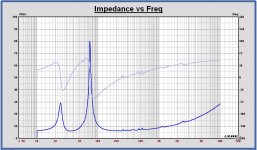 Faital Pro 12PR320 MonkeyB SPL Impedance.JPG121.9 KB · Views: 149
 -
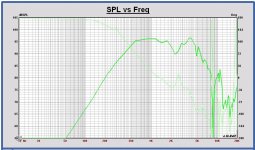 Volt VM752 MonkeyB SPL 1m 0deg 2.83V full space.JPG149.3 KB · Views: 144
 -
 Volt VM752 MonkeyB Impedance.JPG114.1 KB · Views: 126
 -
 ScanR2904+WG148 MonkeyB SPL 1m 0deg 2.83V full space.JPG147.5 KB · Views: 135
 -
 ScanR2904+WG148 MonkeyB Impedance.JPG116.6 KB · Views: 144
Last edited:
- Home
- Loudspeakers
- Multi-Way
- Open Source Monkey Box