Measurement of Power Supply Output Impedance at a particular frequency
The output impedance may be DC /average load dependent. Therefore a variable DC load would serve the purpose.
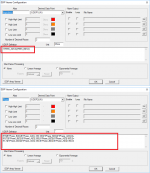
Attached is a sample Panel Setting File which can be used to measure the power supply output impedance at a particular frequency. It can be loaded into MI via [Setting]>[Load Panel Setting]. The two UDDPs are defined as follows (see attached screenshot):
1. UDDP1 (Impedance): 1*[RMS_A(EU)]/[RMS_B(EU)]
2. UDDP2(Phase):
IFIN([f1Phase_B(D)]-[f1Phase_A(D)],-180,180,[f1Phase_B(D)]-[f1Phase_A(D)],0)+
IFGT([f1Phase_B(D)]-[f1Phase_A(D)],360,[f1Phase_B(D)]-[f1Phase_A(D)]-360,0)+
IFLT([f1Phase_B(D)]-[f1Phase_A(D)],-360,[f1Phase_B(D)]-[f1Phase_A(D)]+360,0)
The above phase definition here is a little complicated than its simplest form “[f1Phase_B(D)]-[f1Phase_A(D)]”. It wraps the phase difference into the range of -180 degree ~180 degree. The definition of those math functions IFIN(), IFGT(), IFLT() can be found in Section 10.2.2 of the software manual.
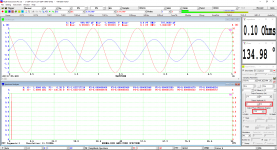
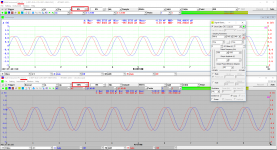
The attached last screenshot shows a loopback test result using this PSF file. The signal generator generates a voltage ratio of 0.1 and phase difference of 135 degree in the two channels. The measured impedance and phase shift is 0.1 ohms and 134.98 degree respectively.
OK, I will try the method 4 via Device Test Plan, but I will need more time, the DTP procedure is unknown to me for now.
I have a Rigol dc load, then it is easy this implementation in my situation.
But, it is not clear to me the role of the dc blocking capacitor and line transformer in the circuit?
The output impedance may be DC /average load dependent. Therefore a variable DC load would serve the purpose.
Attached is a sample Panel Setting File which can be used to measure the power supply output impedance at a particular frequency. It can be loaded into MI via [Setting]>[Load Panel Setting]. The two UDDPs are defined as follows (see attached screenshot):
1. UDDP1 (Impedance): 1*[RMS_A(EU)]/[RMS_B(EU)]
2. UDDP2(Phase):
IFIN([f1Phase_B(D)]-[f1Phase_A(D)],-180,180,[f1Phase_B(D)]-[f1Phase_A(D)],0)+
IFGT([f1Phase_B(D)]-[f1Phase_A(D)],360,[f1Phase_B(D)]-[f1Phase_A(D)]-360,0)+
IFLT([f1Phase_B(D)]-[f1Phase_A(D)],-360,[f1Phase_B(D)]-[f1Phase_A(D)]+360,0)
The above phase definition here is a little complicated than its simplest form “[f1Phase_B(D)]-[f1Phase_A(D)]”. It wraps the phase difference into the range of -180 degree ~180 degree. The definition of those math functions IFIN(), IFGT(), IFLT() can be found in Section 10.2.2 of the software manual.
The attached last screenshot shows a loopback test result using this PSF file. The signal generator generates a voltage ratio of 0.1 and phase difference of 135 degree in the two channels. The measured impedance and phase shift is 0.1 ohms and 134.98 degree respectively.
Attachments
Measurement of Power Supply Output Impedance in a frequency range
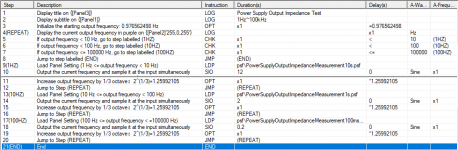
Attached zip file contains a sample device test plan which can be used to measure the power supply output impedance in a frequency range from 1Hz to 100kHz at a step of 1/3 octave. It contains three Panel Setting Files (PSF) and one DTP file. The PSF file should be put in the \psf subfolder of MI, and the DTP file should be put in the \dtp subfolder of MI. Then the DTP file can be loaded into Device Test Plan to run.
The test plan uses a variable X1 to generate frequency stepped sine waves from 1Hz to nearly 100kHz (limited by RTX6001’s max. sampling rate 200kHz and its analog bandwidth). In each signal output step, the test frequency will be increased by 1/3 octave: 2^(1/3)=1.25992105, that is X1=X1*1.25992105. (It is also possible to specify test frequency explicitly rather than using variables. Specifying test frequencies explicitly is simpler but needs much more test steps)
The lower the test frequency, the longer the sampling duration required. Three PSF files are thus created for 1Hz~10Hz (10s), 10Hz~100Hz (1s), and 100Hz~100kHz (100ms) respectively. They are:
1. PowerSupplyOutputImpedanceMeasurement10s.psf
2. PowerSupplyOutputImpedanceMeasurement1s.psf
3. PowerSupplyOutputImpedanceMeasurement100ms.psf
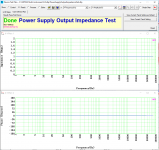
The script of the test plan (PowerSupplyOutputImpedanceTest.dtp) and its loopback test results are shown in the attached screenshots.
Attached zip file contains a sample device test plan which can be used to measure the power supply output impedance in a frequency range from 1Hz to 100kHz at a step of 1/3 octave. It contains three Panel Setting Files (PSF) and one DTP file. The PSF file should be put in the \psf subfolder of MI, and the DTP file should be put in the \dtp subfolder of MI. Then the DTP file can be loaded into Device Test Plan to run.
The test plan uses a variable X1 to generate frequency stepped sine waves from 1Hz to nearly 100kHz (limited by RTX6001’s max. sampling rate 200kHz and its analog bandwidth). In each signal output step, the test frequency will be increased by 1/3 octave: 2^(1/3)=1.25992105, that is X1=X1*1.25992105. (It is also possible to specify test frequency explicitly rather than using variables. Specifying test frequencies explicitly is simpler but needs much more test steps)
The lower the test frequency, the longer the sampling duration required. Three PSF files are thus created for 1Hz~10Hz (10s), 10Hz~100Hz (1s), and 100Hz~100kHz (100ms) respectively. They are:
1. PowerSupplyOutputImpedanceMeasurement10s.psf
2. PowerSupplyOutputImpedanceMeasurement1s.psf
3. PowerSupplyOutputImpedanceMeasurement100ms.psf
The script of the test plan (PowerSupplyOutputImpedanceTest.dtp) and its loopback test results are shown in the attached screenshots.
Attachments
Last edited:
How many inputs can MI PRO handle?
I need to acquire 3 inputs simultaneously, can MI PRO do that?
I have an 8 channel sound card.
Thanks,
Lukas
I need to acquire 3 inputs simultaneously, can MI PRO do that?
I have an 8 channel sound card.
Thanks,
Lukas
that's an easy one, open more instances of MI and define the source for your multiple channels
or do you want the 3 inputs to operate on the same data set?
Cheers
Alan
or do you want the 3 inputs to operate on the same data set?
Cheers
Alan
Multi Instances of Multi-Instrument
Yes, currently one instance of MI supports two analog input channels only. Multiple instances of MI can be launched from the same PC. Each instance can point to different ADC devices, different pair of channels of the same ADC device (sound cards) , or even the same pair of channels of the same ADC device (sound cards), thanks to the multi-client support capability of MME driver and some ASIO drivers.
The attached picture shows two instances of MI pointing to the same pair of input channels of RTX6001 under ASIO. Instance 1 has the trigger level set at 0% while Instance 2 has the trigger level set at 50%. And they work independently in this regard. There can be control conflict, though. Usually the RTX6001 follows the latest control received.
Attachments
Last edited:
Correction on Post #401 and #402
Sorry, I made an error in the UDDP definition of the Phase Shift. It should be defined as follows:
UDDP2 (Phase):
IFIN([f1Phase_B(D)]-[f1Phase_A(D)],-180,180,[f1Phase_B(D)]-[f1Phase_A(D)],0)+
IFGT([f1Phase_B(D)]-[f1Phase_A(D)],180,[f1Phase_B(D)]-[f1Phase_A(D)]-360,0)+
IFLT([f1Phase_B(D)]-[f1Phase_A(D)],-180,[f1Phase_B(D)]-[f1Phase_A(D)]+360,0)
The device test plan containing all the required PSF files is attached here.
Attachments
OK to be a little more clear, I'll do a frequency sweep, say 10 Hz to 1 KHz.
For input 1, I need amplitude.
For inputs 2&3, I need amplitude and phase for each, with phase referenced to input 1.
Can multiple instances of MI Pro acquire such a setup and export to delimited ASCII format for analysis and manipulation in external software?
Lukas
For input 1, I need amplitude.
For inputs 2&3, I need amplitude and phase for each, with phase referenced to input 1.
Can multiple instances of MI Pro acquire such a setup and export to delimited ASCII format for analysis and manipulation in external software?
Lukas
Yes, currently one instance of MI supports two analog input channels only. Multiple instances of MI can be launched from the same PC. Each instance can point to different ADC devices, different pair of channels of the same ADC device (sound cards) , or even the same pair of channels of the same ADC device (sound cards), thanks to the multi-client support capability of MME driver and some ASIO drivers.
That means you'd have to rely on those drivers to pass a clean copy of the raw data from the audio interface. I have no experience with Windows audio, but I have heard nasty things...
Would it be difficult to extend the number of channels in MI Pro? If it is, it may be easier to look for other software packages that already do cope with more than two channels.
two instances? one for 1 & 2 and one for 1 & 3?
post comparison of data sets for 2 & 3?
we are of course assuming you are not using the RTX exclusively as it only has two channels.
Cheers
Alan
post comparison of data sets for 2 & 3?
we are of course assuming you are not using the RTX exclusively as it only has two channels.
Cheers
Alan
two instances? one for 1 & 2 and one for 1 & 3?
post comparison of data sets for 2 & 3?
we are of course assuming you are not using the RTX exclusively as it only has two channels.
Cheers
Alan
I don't have a RTX, I'll be using an 8 channel MOTU USB sound device Ultralite Mk3
Lukas
Multi Instances of Multi-Instrument for Multi-channel (more than 2) data acquisition
I believe Motu ASIO supports multi-client applications.
The mapping between physical channels to logical channels (Ch. A and Ch. B) can be configured via [Setting]>[ADC Device]>"Analog Channel Configuration" and [Setting]>[DAC Device]>"Channel Configuration". The maximum numbers of physical input and output channels supported by MI is 200 and 200 respectively, so even audio interfaces like RME MADIface XT which supports 196 input channels and 198 output channels should work.
If Input Channels 1 &2 are selected in MI Instance 1, and Input Channels 1&3 are selected in MI Instance 2, synchronization between the two instances (if required) can be achieved if the same trigger parameters are set on Channel 1.
Data and Bitmap Export from a Graph Window
In MI, data in a graph window (i.e. oscilloscope, spectrum analyzer, spectrum 3D plot, X-Y Plot in Device Test Plan, Data Logger) can be exported as a CSV text file by right click the graph window and select "Export". The default "Save as Type" is CSV text file. You can change the "Save as Type" to a BMP file if you want to export the graph as a BMP file.
In the right-click popup context menu, you can also select "Copy As Text" or "Copy As Bitmap" to copy the data or graph into Windows clipboard and then paste them into other software such as Excel, Word or Notepad.
Many thanks for the Help, Virtins.
I have done some testing with this, but I would like to clarify some points with the connection.
1) The signal output of RTX will be the SE?
2) As you wrote we used the two ADC inputs Ch.A & Ch.B. for the V1 & V2 respectively. For V1->hot(2) of xlr Ch.A and for V2 hot(2) of xlr Ch.B or cold(3)?
3) What about gnd(1) of xlr? We let them without connection?
Attachments
Hi VIRTINS,
There is one change I'd really like to see. The ability to run channel 2 alone. So you would have channel 1 channel 1 & 2 then channel 2 in the drop down menu. That allows us to see channel 2 separately which is what I need to do.
-Chris
There is one change I'd really like to see. The ability to run channel 2 alone. So you would have channel 1 channel 1 & 2 then channel 2 in the drop down menu. That allows us to see channel 2 separately which is what I need to do.
-Chris
Sorry Chris,
Could you say that again? In different words? Couldn't quite follow what you wanted.
Cheers
Alan
Could you say that again? In different words? Couldn't quite follow what you wanted.
Cheers
Alan
Hi Alan,
Sure, I'd like either channel alone on the screen, or both if desired. Right now I can only have channel 1 or both on.
-Chris
Sure, I'd like either channel alone on the screen, or both if desired. Right now I can only have channel 1 or both on.
-Chris
me three ...
mlloyd1
mlloyd1
I'm with Chris here, I'd like to see that option as well.
Guys, something goes wrong with my measurements.
I have made two kind of Zo measurements.
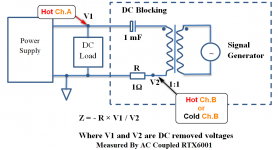
A. without RTX - two Fluke RMS multimeters on V1 & V2 measure Vac values . A function generator (Hameg HM-605) feeds the ac signal without any transfo btw. A Rigol dc load, a 1uF capacitor and 1R resistor.
The following diagram seems the connection on this test.

Here the array with results and a diagram of Ζο on three dc-loads (0.1/0.5/1.0A).
At the Impedance Zo column the formula Z=-R*(V1/V2) used for the Zo, but this gives negative values! I used the positive values of them and draw the diagram.

B. Next, I followed the Virtin's directions with the RTX-6001 (I removed the 1:1 transfo, I haven't complete yet). The connection was as following:

I run the script on DUT and I had completely different results than A

What I have done wrong! Please, any help will be welcome!
I have made two kind of Zo measurements.
A. without RTX - two Fluke RMS multimeters on V1 & V2 measure Vac values . A function generator (Hameg HM-605) feeds the ac signal without any transfo btw. A Rigol dc load, a 1uF capacitor and 1R resistor.
The following diagram seems the connection on this test.
Here the array with results and a diagram of Ζο on three dc-loads (0.1/0.5/1.0A).
At the Impedance Zo column the formula Z=-R*(V1/V2) used for the Zo, but this gives negative values! I used the positive values of them and draw the diagram.
B. Next, I followed the Virtin's directions with the RTX-6001 (I removed the 1:1 transfo, I haven't complete yet). The connection was as following:
I run the script on DUT and I had completely different results than A
What I have done wrong! Please, any help will be welcome!
1) The signal output of RTX will be the SE?
2) As you wrote we used the two ADC inputs Ch.A & Ch.B. for the V1 & V2 respectively. For V1->hot(2) of xlr Ch.A and for V2 hot(2) of xlr Ch.B or cold(3)?
3) What about gnd(1) of xlr? We let them without connection?
1) Using differential output would nearly double the output voltage, as compared with SE output, which is preferred when the power supply's output impedance to be measure is very low.
2) V1 and V2 are ground referenced voltage. V2 hot(2) should be used. Using cold(3) of xlr Ch.B is also OK, as long as the 180 phase difference is accounted for in the phase vs frequency plot. It will not affect the |Impedance| reading.
3) No need to connect gnd(1) of xlr.
- Home
- Group Buys
- GB for Virtins MI Pro for RTX6001 autoranging/autoscaling & for soundcard end users