I put the pic back to portrait.
I changed the tint to Reel.
I think because the 1st pic in my original post was landscape, the site switched the 2nd pic to landscape since I attached 2 pics in the same post.
This make so much sense that it's obvious!
Right.
🙄
I suspect this has been requested before, but can there be a feature to export schematics as Parabolic profiles instead of just uni, con and exp? That would make it a lot easier to convert to a cutsheet probably
Hi StainlessSteve,
A Par option hasn't been requested before, and for good reason - it would have no application in a practical build.
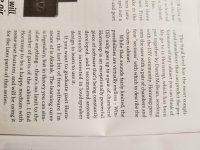
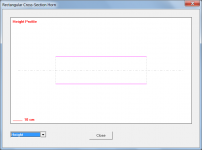
A rectangular cross-section parabolic horn is normally constructed with two tapered sides and two parallel sides. The Con option should be used in this case. A Par option would not make it easier to convert to a cutsheet, it would in fact make it a lot more difficult.
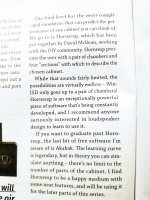
Select the Con option and set the S1 height equal to the S2 height as shown in attachment 1. The resulting side panel profiles are shown in attachments 2 and 3. The exported data will match these profiles.
Kind regards,
David
A Par option hasn't been requested before, and for good reason - it would have no application in a practical build.
A rectangular cross-section parabolic horn is normally constructed with two tapered sides and two parallel sides. The Con option should be used in this case. A Par option would not make it easier to convert to a cutsheet, it would in fact make it a lot more difficult.
Select the Con option and set the S1 height equal to the S2 height as shown in attachment 1. The resulting side panel profiles are shown in attachments 2 and 3. The exported data will match these profiles.
Kind regards,
David
Attachments
I put the pic back to portrait.
Just to clarify - Chris says in his article that with AkAbak, "there's no limit to the number of parts of the cabinet". The maximum number of network nodes is actually 56. More than enough for most designs, however 🙂.
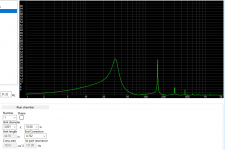
I have an issue I've ran into. When modeling a ML-TL it seemed my vent velocity was much higher than I expected. To sanity check I compared the results from a ported enclosure in WinISD to the same driver/enclosure in HornResp and I'm getting very different vent velocity results. The SPL output and cone excursion is nearly identical between the two, but vent velocity is not. I don't know if I'm doing something wrong somewhere or if its an error/bug in one of the two applications. Based on my past experience I think the numbers WinISD is giving me is fairly accurate. Here are some pics showing my inputs and the difference.
Attachments
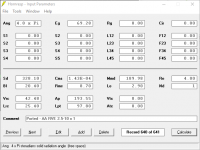
In hornresp change Ang to "2.0 x Pi" and Eg to "34.64" and simulate
Changing the "Ang" doesn't seem to make a difference. If I change the Eg to 34.64 then the port velocity in HornResp is very close to WinISD, however I'm trying to simulate 1200 watts of input power at 4 ohms, not 300 watts. I have 69.3 volts entered into WinISD to get 1200 watts. Why is there a 4x difference in HornResp?
I have an issue I've ran into. When modeling a ML-TL it seemed my vent velocity was much higher than I expected. To sanity check I compared the results from a ported enclosure in WinISD to the same driver/enclosure in HornResp and I'm getting very different vent velocity results. The SPL output and cone excursion is nearly identical between the two, but vent velocity is not. I don't know if I'm doing something wrong somewhere or if its an error/bug in one of the two applications. Based on my past experience I think the numbers WinISD is giving me is fairly accurate. Here are some pics showing my inputs and the difference.
Hi thejessman,
I suspect that WinISD is showing the rms value rather than the peak value, which would explain part of the difference. The other part is likely to be due a problem identified with the WinISD model some time ago - see post linked below.
http://www.diyaudio.com/forums/subwoofers/311268-discrepancy-winisd-hornresponse-2.html#post5169553
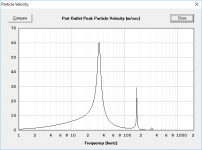
I am pretty confident that the Hornresp peak particle velocity calculations are correct 🙂.
Kind regards,
David
Just to clarify - Chris says in his article that with AkAbak, "there's no limit to the number of parts of the cabinet". The maximum number of network nodes is actually 56. More than enough for most designs, however 🙂.
I've never used AkAbak.I'm just being patient and waiting for you to add that 5th segment to the TH function..
 Don't let me hit the lotto
Hi thejessman,
I suspect that WinISD is showing the rms value rather than the peak value, which would explain part of the difference. The other part is likely to be due a problem identified with the WinISD model some time ago - see post linked below.
http://www.diyaudio.com/forums/subwoofers/311268-discrepancy-winisd-hornresponse-2.html#post5169553
I am pretty confident that the Hornresp peak particle velocity calculations are correct 🙂.
Kind regards,
David
Thanks a lot for responding to my issue. I get what you are saying in regard to the graphs showing RMS vs Peak values and that's something I've wondered about in the past when it comes to WinISD. Unfortunately I've made a lot of design decisions in the past based on what WinISD has reported for port velocity and now I have doubt as to whether I made the right choices or not!!
I think the thing for me to do is to get a hot wire anemometer since they aren't real expensive now, and measure for myself so that I can compare it to simulation. I've been wanting to do this for some time anyway. I'll report back here with what I find.
Hi David,
First of all, thank you for this very powerful software !!
When I try to open/load some of my .dat files I got that "run-time error '13': type mismatch".
On some of my databases I have the error and on some other I don't.
I'm using version 46.00 (180705).
Kind regards,
Florent
First of all, thank you for this very powerful software !!
When I try to open/load some of my .dat files I got that "run-time error '13': type mismatch".
On some of my databases I have the error and on some other I don't.
I'm using version 46.00 (180705).
Kind regards,
Florent
WinISD - RMS vs Peak values
From their Help File in a previous version, as the latest version hasn't got one yet !
I've uploaded it as people are often asking for info, that they can find in there 😉You need to right click on it & change the zip to chm as the forum doesn't upload chm help files 😉
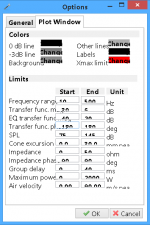
For some unknown reason, since i got a new comp with Win8.1 the options in the latest version look funky 🙁 It was fine on XP 🙂
From their Help File in a previous version, as the latest version hasn't got one yet !
Air velocity - front/rear port
Air velocity graph shows how fast air mass travels in port. In order to keep chuffing noise low, you
should limit the peak velocity at 5% of velocity of sound, or about 17 m/s. Like the cone excursion
graph, the desired powerlevel is set also by same watts setting. Note that if air velocity peaks
exceeds previously mentioned level. This graph can also be configured to show RMS, peak or
peak-to-peak value. See the cone excursion graph explanation for RMS, peak and peak-to-peak values.
I've uploaded it as people are often asking for info, that they can find in there 😉You need to right click on it & change the zip to chm as the forum doesn't upload chm help files 😉
For some unknown reason, since i got a new comp with Win8.1 the options in the latest version look funky 🙁 It was fine on XP 🙂
Attachments
From their Help File in a previous version, as the latest version hasn't got one yet !
I've uploaded it as people are often asking for info, that they can find in there 😉You need to right click on it & change the zip to chm as the forum doesn't upload chm help files 😉
For some unknown reason, since i got a new comp with Win8.1 the options in the latest version look funky 🙁 It was fine on XP 🙂
Thanks for the info!
From what you said I checked and it looks like WinISD was set to show the peak port velocity.
I've already ordered a hot-wire anemometer, I guess I'll see what results I get when it gets here.
NeoDan, I'm testing your theory. I rotated the pic to landscape on my phone and this is what happens.
 I have no idea what your phone will allow after the photo is taken, I was referring to when you are taking photos. The key is to pay attention and learn to control the camera orientation, you should have a little orientation indicator as pictured below.
Attachments

For some unknown reason, since i got a new comp with Win8.1 the options in the latest version look funky 🙁 It was fine on XP 🙂
This can happen when display scaling is not set to 100%
Attachments

When I try to open/load some of my .dat files I got that "run-time error '13': type mismatch".
Hi Florent,
Sorry to hear that you are having problems. Could you please post a copy of one of the .dat files that generates the error, so that I can investigate. To post the .dat file as an attachment, either place it in a zip file, or change the extension from .dat to .txt. Thanks.
Kind regards,
David
From what you said I checked and it looks like WinISD was set to show the peak port velocity.
That's not part of the reason for the discrepancy then, it seems 🙂.
I've already ordered a hot-wire anemometer, I guess I'll see what results I get when it gets here.
Please let us know what you find.
The reason I am pretty confident that the Hornresp peak particle velocity calculations are correct is because the results are the same as those produced by AkAbak 🙂.
From their Help File in a previous version, as the latest version hasn't got one yet !
Hi Zero D,
I think the clue is in the Help File statement: "Air velocity graph shows how fast air mass travels in port." In the system 'thejessman' is looking at, the air in the relatively long port tube is not moving as a simple acoustic mass. WinISD is being asked to analyse what is in effect a cylindrical horn, something it was never designed to do.
Kind regards,
David
- Home
- Loudspeakers
- Subwoofers
- Hornresp