Giancarlo,
Which is the interpretation for those different AC curves? Which are the ones that show the stability or instability?
Which is the problem of using Bode plots to show instability?
About the pot model, I do not use one: just a resistor which I change the value of. Is there a different way?
Which is the interpretation for those different AC curves? Which are the ones that show the stability or instability?
Which is the problem of using Bode plots to show instability?
About the pot model, I do not use one: just a resistor which I change the value of. Is there a different way?
Many thanks Giancarlo!
Although I've got the "pot" symbol unknown and all the transistor models used here are missing in my Cordell-Models.txt
Download LTSpice.zip and extract the 3 files:
standard.bjt
pot.asy
pote.lib
I assume that LTSpice is installed in C:\Program Files\LTC\LTspiceIV otherwise change path according to your directory
Go to C:\Program Files\LTC\LTspiceIV\lib\cmp
Rename standard.bjt to standard.bak, so you have a backup of your old file
Copy standard.bjt in C:\Program Files\LTC\LTspiceIV\lib\cmp
Create new directory C:\Program Files\LTC\LTspiceIV\lib\sym\Pot&Sw and copy pot.asy in it
Copy pote.lib in C:\Program Files\LTC\LTspiceIV\lib\sub
I'm not a LTSpice guru, but hopefully it will works 😀
Attachments
Last edited:
Giancarlo,
Which is the interpretation for those different AC curves? Which are the ones that show the stability or instability?
Which is the problem of using Bode plots to show instability?
About the pot model, I do not use one: just a resistor which I change the value of. Is there a different way?
I think the plots of Valery und de Ocampo are not so different.
But Valery's pot starts at 1k freq. And Valerys phase pot seems to have a phase shift of 180° (may be based on -180° point).
For simple stability at -180° phase shift the loop amplification has to be below 0dB or at 0dB amplification the phase shift has to be above -180°.
Maybe valery can explain that?
Giancarlo,
Which is the interpretation for those different AC curves? Which are the ones that show the stability or instability?
Which is the problem of using Bode plots to show instability?
About the pot model, I do not use one: just a resistor which I change the value of. Is there a different way?
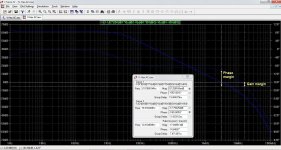
The AC curves are the open loop gain (continuos line) and open loop phase (dotted line) and both are useful to calculate the phase margin and gain margin in order to predict if the amplifier will be stable in a closed loop.
In order to have a stable closed loop amplifier (no self-oscillation) the open-loop margins must be:
Phase margin> 45°
Gain margin> 12dB
These are the minimum margins values and it is better to have higher values, let's say about 60° and about 20dB.
It is useless to have too high values, because otherwise the amp will be overcompensated.
Obviously with LTSpice we will have a simulation with not taking into account all the variables of the real world such as PCB layout, so in the real world very high parasitic capacities could cause self-oscillations.
Below the plot with the open loop phase margin and gain margin of this amplifier
Attachments
Last edited:
Guys,
The tian probe in LTSpice plots the return ratio and not the open loop of the system, I learned it from Maestro David Zan, hence the way i understood is closed loop + return ratio = open loop. I do think Multisim plots it differently hence the differences in results.
Valery's graph had it at;
80° phase margin
-20dB gain margin
Giancarlos graph had it at;
-74° phase margin
-17dB gain margin
The differences could also be the result of spice models used and probably how the progrm captures the data using directive parameters. Correct me if Im wrong..not an LTSpice expert either.
Regards,
Albert
That's absolutely right - we analyze the feedback loop response, not the open loop amplifier response. That's why we inject the signal into the feedback network.
80/74 and 20/17 - the difference is not that high, I think the variance in models may cause the deviation.
80/74 and 20/17 - the difference is not that high, I think the variance in models may cause the deviation.
Hello Valery,
My long overdue VHex+ project, a close friend of mine built it. My board design seems a little bigger because I am using parts locally available (Toshiba devices). In the actual build R24 was changed to 680r to accurately adjust idling current. Build is still in progress.
Cheers!
My long overdue VHex+ project, a close friend of mine built it. My board design seems a little bigger because I am using parts locally available (Toshiba devices). In the actual build R24 was changed to 680r to accurately adjust idling current. Build is still in progress.
Cheers!
Attachments
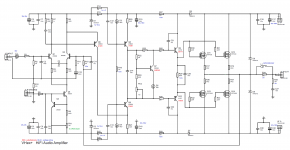
Cool 🙂 Nicely drawn schematic and diy-friendly layout.
Thank you! Lay out was done in Proteus software.
The AC curves are the open loop gain (continuos line) and open loop phase (dotted line) and both are useful to calculate the phase margin and gain margin in order to predict if the amplifier will be stable in a closed loop.
In order to have a stable closed loop amplifier (no self-oscillation) the open-loop margins must be:
Phase margin> 45°
Gain margin> 12dB
These are the minimum margins values and it is better to have higher values, let's say about 60° and about 20dB.
It is useless to have too high values, because otherwise the amp will be overcompensated.
Obviously with LTSpice we will have a simulation with not taking into account all the variables of the real world such as PCB layout, so in the real world very high parasitic capacities could cause self-oscillations.
Below the plot with the open loop phase margin and gain margin of this amplifier
Giancarlo,
Can you modify the asc file I uploaded, adding whatever is necessary to use the Tyan Probe? Then I can add it to my AC sims.
What about Bode plots, like the one I uploaded?
Giancarlo,
Can you modify the asc file I uploaded, adding whatever is necessary to use the Tyan Probe? Then I can add it to my AC sims.
What about Bode plots, like the one I uploaded?
File uploaded.
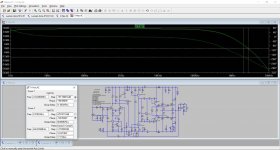
In the first file that I've uploaded, I forgot to short-circuit the input capacitor and for this reason the gain margin was not accurate.
Now gain margin is 20dB and phase margin is not changed (70°).
The plots are the loop gain & loop phase (NOT open loop)
Sorry for mistakes..
Your Bode plots?
The output in your file is in the wrong place.
The output is after the inductor, parallel to the load.
Perform AC analysis and click on the output and you will have the frequency response.
Only if there is a very big stability problem a huge peak (>>6dB) will be present on the output.
Not very useful to catch stability issues.
Attachments
Last edited:
But that's for the Tyan probe, not the Bode plot, isn't it?
By using the tian probe you are determining the stability analysis graph represented in magnitude (dB) and phase (degrees) of the transfer function, and this method I believe is Bode plot.
Loop Gain Simulation - Frank Wiedmann
When you invoke tian probe do not forget to copy paste the expression (by replacing Vout in the graph)
Hope it helps!
Last edited:
Carlmart, I see what you meant in the plot #512 now. That's no problem. The fact that the phase crosses 180 degrees before the gain crosses 0bd on the bode plot of the amplifier (the loop is closed) does not tell you anything about stability. Because the feedback loop response is compensated in a way that as soon as the feedback signal reaches the "-" input of an amplifier, stability conditions are met.
That's why we use the Tian probe (and some other methods) for performing the feedback loop AC analysis - that's where we see the stability margins.
That's why we use the Tian probe (and some other methods) for performing the feedback loop AC analysis - that's where we see the stability margins.
I'm glad we seem to be getting somewhere on what we mean to say.
Now I'm eager to know how to handle the Tyan probe on other amps I was working with that seemed to be unstable. Particularly how to diagnose that by looking at the curves.
How do I get to get a plt file? I've changed the parameters on my asc file to Giancarlo's, but the plt file seems to be essential. But just renaming Giancarlo's plt file does not get his results and screen.
You can try this one with OITPC.
Damir
Hi Damir,
A valid option, however, I like to keep compensation as "light" as possible.
Lender configuration ensures a better phase response than a "regular" common-emitter VAS, so a simple RC at the left collector of LTP is enough for shaping the phase response, ensuring the loop stability.
Cheers,
Valery
- Home
- Amplifiers
- Solid State
- Sons of VHex