Do there two plots satisfy you? (I’ll ask my commission from JBL)
😀
George
iIs interesting how two graphic presentations of the same information can be so different that for me I'm have some difficulty visualizing the data in a familiar way. I understand that this is why in our current computer driven electronic age X Ray's are presented the same as they were when it was X Ray film. I'm far more familiar with the usual line plots.
The waterfall plot probably shows any issues in the decay but its only 30 dB and in a totally different format. The distortion plot was incomprehensible to me but the caption said something about 3% which seemed high if I was reading it right. I did see what seem to be discontinuity's in the lateral and vertical plots around 3 KHz. Nothing big. However a square horn may well have odd things happening at those corners that won't show in a vertical/horizontal plot.
(FWIW my day job is to dismantle new tech to find the underlying lies and deception. It provides no end of entertainment.)
well 3% at 106dB @8m is fark loud for a domestic setting. The other disortion graph was SPL for 3% distortion, which again showed silly loud.
Earth Beat.
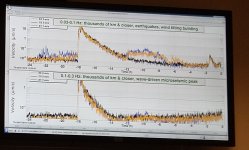
Talk about confounders, while at LIGO we were lucky enough to see the effects of the 7.7 magnitude earthquake that took place Friday deep in the Marianas Trench. The upper display is in micro-meters per second rms in a .03 to .1Hz BW on a log scale so for a decaying exponential of the earth ringing down from the "impulse" excitation you get a roughly linear decay as seen. The noise floor before was better than 10nm per sec. at deep sub-Hz, pretty amazing. I was told the blue and orange plots were the important ones and that the noise after the earthquake was a local dust storm.
I got the impression this display was sort of just for show like an indoor/outdoor thermometer plotting temperature and generated real time from raw data.
I think jn would appreciate the fact that just before we arrived someone plugged the safety shutter input into the wrong jack. The laser cavities are pumped up to as much as 500kW and are tuned to a DEEP null at the detector and even a slight loss of phase lock activates a shutter to protect the optics at the detector, needless to say the alarm was ignored and the magic smoke got out. The upside was we got a better tour because everything was shut down.
Nice to be around some hard science and NO nonsense.
Attachments
well 3% at 106dB @8m is fark loud for a domestic setting. The other disortion graph was SPL for 3% distortion, which again showed silly loud.
That's loud enough to be not too useful. Your ear (and air itself) are nonlinear at those levels. What is the distortion at 100 dB, 80 dB, 60 dB? Are the amplitudes linear as the levels increase. I know that there are compression effects at high levels with dynamic drivers (once worked on a fixture for quantifying that). Richard was claiming that the ESL was compressing by comparison. My experience with ESL's was that they self destruct or bang into limiters rather than compress but they do not get to those levels.
Demian,
I agree I much prefer the older discrete waterfall type of plots where you can see trends and high Q peaks in the decay. These color plots seem to be the new age graphing representation but leave much to be desired in resolution. E. Geddes seems to prefer these types of graphs but they just seem to make it hard to see any real details. Many times you have to be careful as the graphing axis are rotated.
I agree I much prefer the older discrete waterfall type of plots where you can see trends and high Q peaks in the decay. These color plots seem to be the new age graphing representation but leave much to be desired in resolution. E. Geddes seems to prefer these types of graphs but they just seem to make it hard to see any real details. Many times you have to be careful as the graphing axis are rotated.
As a friend says sometimes, will blunders never cease?
They said repair was about a week of someone assembling a ship in a bottle at arms length in a bunny suit but not a large financial loss. Every important optic is mechanically isolated in a cascade of 4 assemblies to the level of 10^-10 and suspended by glass fibers drawn with a CO2 laser.
You can suspend a table from 4 fibers and pound on it with a hammer but if so much as touch the fiber the contamination of your skin will compromise the outer layer of atoms and it will instantly disintegrate.
that DOES sound like fun, and to get paid for it too!
i'm probably dating myself if i say i remember as a kid showing up the neighbor "rich" kid by demonstrating his new expensive walkie talkie had a bunch of fake transistors to ramp up the transistor count for bragging rights.
😀
mlloyd1
...
(FWIW my day job is to dismantle new tech to find the underlying lies and deception. It provides no end of entertainment.)
i'm probably dating myself if i say i remember as a kid showing up the neighbor "rich" kid by demonstrating his new expensive walkie talkie had a bunch of fake transistors to ramp up the transistor count for bragging rights.
😀
mlloyd1
It might help to read the paper and understand the hypothesis being tested before rambling.
My comments were not so much directed at the specific study, but rather with some problems that often occur with studies and with how consumers of research often tend to use it.
With regard to the particular meta study, I thought it was pretty reasonable attempt to sort out the prior research. One area that I still wonder about has to do with what has been tried with training so far. My question would be, what about the effects of prolonged practice? We know, for example, that music majors in college have to take ear training class. If it is like most things, being given a detailed explanation and some immediate feedback about test performance on a one-time test is a good thing, but far from optimum for learning. At least for many things, practice over time is usually required to develop something more like akin to expert performance.
And, I still wonder about the effects of looking during hearing practice. I can think of guitar players, for example, that can't play without looking because that's the only way they ever practiced. Part of what has been learned by them is hand-eye coordination, combined with listening to music. Others who were forced by their teacher not to look, or keep eyes on sheet music, formed different types of brain neural patterns for playing as compared to the lookers.
<snip> Richard was claiming that the ESL was compressing by comparison. My experience with ESL's was that they self destruct or bang into limiters rather than compress but they do not get to those levels.
Well, that depends on the size and of course the frequency range. These were measured afair (same measurement suite) to give ~118 dB at 4m distance (150 - 20 kHz):
http://www.a-t-e.de/pdf/IFA_ESL_WEB.pdf
Addled from all the chemicals and excessive exposure to Jan Didden, that's me.
How do you think I feel?? Before i met you I couldn't even spell 'scieintist' and now I are one.
Jan
Like any good researcher, I go where the evidence takes me. Of course, it helps to not have a paycheck depend on the outcome...
As every true believer you seem to be a bit blind to your own bias effects; that does not prevent one from doing good research, provided it fits the believe system .
And of course it would help to not have to defend a radical exchange in the belief system..... 😉
With regard to the particular meta study,
It wasn't a meta study. You might want to actually read it. I know, nutty idea to actually read something before commenting about it, but some people are just funny that way.
It wasn't a meta study. You might want to actually read it. I know, nutty idea to actually read something before commenting about it, but some people are just funny that way.
This is the meta study that I liked: http://www.diyaudio.com/forums/atta...rt-ii-meta-hi-res-aes-64-6-june2016-18296.pdf
As every true believer you seem to be a bit blind to your own bias effects
Yes, that must be it.
As every true believer you seem to be a bit blind to your own bias effects;
You would think that after all these years TRUE BELIEVERS from both sides would at least once have participated in a test where they were both listening to the same thing at the same time. A DBT (any protocol) being inherently flawed in some way is also a "true belief".
Last edited:
You would think that after all these years TRUE BELIEVERS from both sides would at least once have participated in a test where they were both listening to the same thing at the same time.
They did- see the Lipshitz/Tiefenbrun tests. Unfortunately for the narrative, the wrong person heard the differences.😀
They did- see the Lipshitz/Tiefenbrun tests. Unfortunately for the narrative, the wrong person heard the differences.😀
Missed that, I was thinking of members present and imagine SL is a poster child for expectation bias.
Talk about confounders, while at LIGO we were lucky enough to see the effects of the 7.7 magnitude earthquake that took place Friday deep in the Marianas Trench. The upper display is in micro-meters per second rms in a .03 to .1Hz BW on a log scale so for a decaying exponential of the earth ringing down from the "impulse" excitation you get a roughly linear decay as seen. The noise floor before was better than 10nm per sec. at deep sub-Hz, pretty amazing. I was told the blue and orange plots were the important ones and that the noise after the earthquake was a local dust storm.
I got the impression this display was sort of just for show like an indoor/outdoor thermometer plotting temperature and generated real time from raw data.
I think jn would appreciate the fact that just before we arrived someone plugged the safety shutter input into the wrong jack. The laser cavities are pumped up to as much as 500kW and are tuned to a DEEP null at the detector and even a slight loss of phase lock activates a shutter to protect the optics at the detector, needless to say the alarm was ignored and the magic smoke got out. The upside was we got a better tour because everything was shut down.
Nice to be around some hard science and NO nonsense.
They didn't follow the Radiohead advice: "No alarms, and no surprises, please".
I'd been waiting to hear about your trip to LIGO, kinda a pilgrimage for us big nerds. 😀
Also, about 6-8 months ago I did a lit review of another paper trying to identify if people could confidently hear the difference between sample rates (iirc 44.1k vs 96k, both at 24 bit depth) in what was at least a decent experimental setup. The paper and I reached different conclusions (it read like a classic case of data wrangling to show, albeit very slight, a "positive" result).
I have nowhere near the same amount of experimental experience others here have (read: I'm a young'un), but there's a lot of subtle ways for shenanigans to show up as "real" results if you're not careful. Which also means if you're gunning for an answer, you can probably find it hook or crook.
- Status
- Not open for further replies.
- Home
- Member Areas
- The Lounge
- John Curl's Blowtorch preamplifier part II