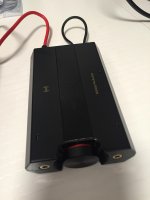
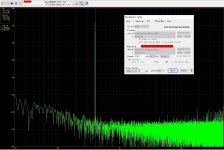
Out of curiosity, I borrowed a Sound Blaster E5 mentioned in post #128, and did some measurement with Audio Tester, with results attached.
BTW, E5's ASIO driver will crash ARTA, but works OK in Audio Tester.
BTW, E5's ASIO driver will crash ARTA, but works OK in Audio Tester.
Attachments
Seems to work quite well. Have you compared with another soundcard?
That question is my main objective against soundcard measurement. How do we ensure that 1V measured with one card is 1V on the next? I believe we need universal references when measuring with soundcards. The rest of you doesn't see it as a problem - why? Have I missed something?
Regards
That question is my main objective against soundcard measurement. How do we ensure that 1V measured with one card is 1V on the next? I believe we need universal references when measuring with soundcards. The rest of you doesn't see it as a problem - why? Have I missed something?
Regards
Last edited:
Seems like the Xonar U7 is usable for some measurements.
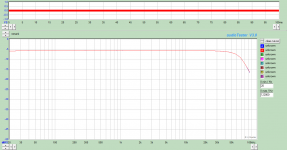
what is dip at 100hz??
Yes, a dip occurs at around 100Hz. But at somewhat different location when I use SoundEasy. For two channel measurement system like SoundEasy, this does not create a problem because a reference channel loop back cancels out the dip as well as the high frequency drop.
Seems to work quite well. Have you compared with another soundcard?
That question is my main objective against soundcard measurement. How do we ensure that 1V measured with one card is 1V on the next? I believe we need universal references when measuring with soundcards. The rest of you doesn't see it as a problem - why? Have I missed something?
Regards
It's way better than the onboard sound card of my notebook, but THD (+N) is quite worse (9dB difference) than the QA400 that I have.
About the universal references, most of these software have a calibration feature, where we tell the software the DMM and/or scope measurement of some input signal, and the software will calibrate accordingly.
...with results attached.
Hi cwtim01. Interesting difference. I agree with the noise observation, it's audible with sensitive IEMs. What were the test conditions and the source?
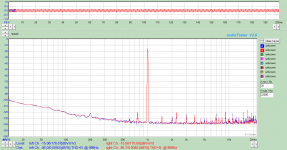
Edit: Out of curiosity I repeated the test, this time with Creative's ASIO driver and with the digital volume control set to full. Visible spectra essentially disappeared but indicated THD rose, suggesting a measurement artifact?
Attachments
Last edited:
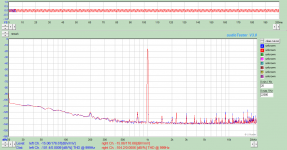
Test condition:
Source: E5 line out, ASIO, fs 192K/32bit, -20 dBfs
Notebook on battery.
I think the noise floor of below -135 dB is actually very good (it'll degrade quite a bit if the power adapted is connected), what it loses to the QA400 is that the signal it generated is less clean, but at below -100 dB THD it's not bad at all. It'll be interesting to couple the E5 with a low THD oscillator like Victor's oscillator (if you can find one).
Test condition:
Source: E5 line out, ASIO, fs 192K/32bit, -20 dBfs
Notebook on battery.
It'll be interesting to couple the E5 with a low THD oscillator like Victor's oscillator (if you can find one).
Victor still sells them both on ebay and if you PM Jim 🙂.
Regards
Hi cwtim01. Interesting difference. I agree with the noise observation, it's audible with sensitive IEMs. What were the test conditions and the source?
Edit: Out of curiosity I repeated the test, this time with Creative's ASIO driver and with the digital volume control set to full. Visible spectra essentially disappeared but indicated THD rose, suggesting a measurement artifact?
What operating system? The Windows audio subsystem in some releases is known to have a resampler that adds THD. Using ASIO drivers may bypass this issue.
Archimago's Musings: MEASUREMENTS: Audiophile Sound and Operating Systems. (Windows 8.1, Windows 10, Fidelizer & JPLAY again!)
Test condition:
Source: E5 line out, ASIO, fs 192K/32bit, -20 dBfs
Notebook on battery.
I think the noise floor of below -135 dB is actually very good (it'll degrade quite a bit if the power adapted is connected), what it loses to the QA400 is that the signal it generated is less clean, but at below -100 dB THD it's not bad at all. It'll be interesting to couple the E5 with a low THD oscillator like Victor's oscillator (if you can find one).
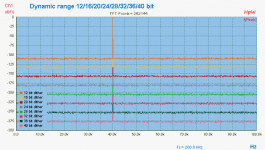
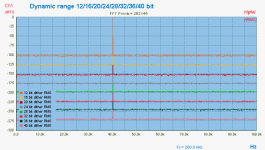
The noise floor also depends on the size of the FFT used for the analysis. You can reduce it by simply using a larger FFT size. Therefore, its not a stable reference for judging quality.
What operating system? The Windows audio subsystem in some releases is known to have a resampler that adds THD. Using ASIO drivers may bypass this issue.
Since MS Vista we have a new sound API call WASAPI.
WASAPI has to modes none - exclusive (mixer mode) and exclusive mode (application takes 100% control of) and this exclusive mode brings back the 100% bit accuracy 😀
Just validate using my SW

Hp
The noise floor also depends on the size of the FFT used for the analysis. You can reduce it by simply using a larger FFT size. Therefore, its not a stable reference for judging quality.
for each 2^x increase the noise floor will/should go down -3dB.
This is sometimes a nice side effect to get into the lowest side peaks. The whole thing really depends on the used detector. Traditional FFT detectors are peak based.
The thing arises from a large FFT size as say 2^19 ... and the real x-axis data presented (means display pixels) has a 1024 as an example. Soon I will present a true RMS detector where the sample size will show the same flat noise level.
Hp
I think shorted input power level measurement is more interesting measurement of
the real noise floor.
Frex
the real noise floor.
Frex
I think shorted input power level measurement is more interesting measurement of
the real noise floor.Frex
Really, it does not help ... while it's still FFT 2^n dependent!
Again look here about the f(Peak) vs f(RMS) (not FFT size dependent) noise levels on various Bits sizes... 😀
Hp
Attachments
Digital analysis can provide great tools for measuring noise but lead to a lot of confusion on understanding what you are seeing. Comparing a classic analog SNR to an FFT can be very misleading. What you need to do (in the software) is add the contribution of noise in each bin the same way the analog system would to have comparable numbers. You really can't gauge it from just looking.
HpW-
I'm a little lost understanding RMS vs. peak in the FFT measurement. Can you explain it a little more and how to relate it to other measurements?
HpW-
I'm a little lost understanding RMS vs. peak in the FFT measurement. Can you explain it a little more and how to relate it to other measurements?
On IEM's and if you are listening to digital silence and hearing noise you have too much gain or too much noise in the post volume amplifier. 100 dB SNR should be inaudible except under extreme circumstances. You also probably have a peak output more like 130 dB which is hazardous.
You also probably have a peak output more like 130 dB which is hazardous.
It's audible with nothing playing. It is at a level that isn't obvious and might be mistaken for room noise leakage. Unplugging the IEM from the amp results in a perceptible drop. On the E5's volume scale 24 out of 100 is loud for me and almost exclusively used on soundscape and nature recordings.
Digital analysis can provide great tools for measuring noise but lead to a lot of confusion on understanding what you are seeing. Comparing a classic analog SNR to an FFT can be very misleading. What you need to do (in the software) is add the contribution of noise in each bin the same way the analog system would to have comparable numbers. You really can't gauge it from just looking.
HpW-
I'm a little lost understanding RMS vs. peak in the FFT measurement. Can you explain it a little more and how to relate it to other measurements?
While was expecting this question... 😀
FFT analyzer are able to more things... and not heavy duty 😀
in case you know to deal with:
- Sample size
- Sample freq.
- Bit size used
- FFT Window & resolution bandwidth
- FFT Window filter shape with signal or noise
- marketing bits form ADC/DAC's
- ...
In the other hand it's a math./DSP algorithm with it's strengths.
My new upcoming f(RMS) Detector against traditional f(peak) deals with the FFT bins.
Means, if you have a 2^18 (262'144) sample size, the resulting FFT spectrum size will have 2^17 (131'972) FFT bins = RMS Data points.
Now having 131'972 RMS data values but on your screen you may display on the X-Axis 1024 pixels.
Means you have to deal with this data reduction 128 : 1 (RMS data values / pixel). This is the question of the detectors.... Peak/RMS/Min/Avg/.... and required re scaling (took me several month how to deal with this).
Using my RMS detector, results in a FFT size independent noise floor. 😀
Keep in mind, the f(peak) is very useful to get a view into the some nasty peaks
Hp
- Status
- Not open for further replies.
- Home
- Design & Build
- Equipment & Tools
- USB sound card for audio spectrum analysis