Adding zeros to the impulse means making up data (zeros in that case) that might or might not represent reality. It's an assumption how the impulse will look like without actually measuring it.
An assumption that with minimum phase data is perfectly correct. With non-minimum phase data it need not be correct but turns out to virtually always be correct. In an anechoic chamber this data would always be zero (above say 200 Hz) - why is it such a stretch to force it to zero when there are reflections? I'm surprised that this bothers you. If you think it through it can't be any other way.
Then I don't understand what you're trying to show with those graphs.
His examples prove the point - thanks Dumptruck.
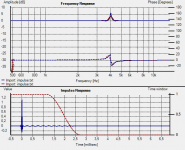
And why does the low end behave like it does, with the "upturned tail" look to it?
This happens because the infinite impulse response must have an average value of zero since there cannot be any DC response. When you truncate the data there is no guarantee that this average will be zero so there is a dip and then a DC peak that is erroneous. With my software I can vary how the window is truncated and I can make this error go away, but alas not even I can make the data below the window cutoff frequency actually correct.
1) The problem is low(er) frequencies
2) Earl doesn't have an anechoic chamber at his disposal
I have gating, I don't need an anechoic chamber - that's the point!! An anechoic measurement would be identical to mine above 200 Hz.
You are correct indeed, don't know what crossed my mind 😱By zero padding you just interpolate (well, not really, it's just smoothed).
Well, looks like I need to go to bed 😴
Zero padding is not interpolation. The math to prove this is way beyond what I am willing to post (and probably over most everyone's head.) If you guys think you are right then post the proof just as Dumptruck posted proof that the window does not affect the smoothing.
I just did exactly that. Here are the results, as obvious:Just go look at HolmImpulse. Take a measurement and change the window The data above the cutoff does not change unless new reflection enter the window. The window length does not affect the data above the cutoff.


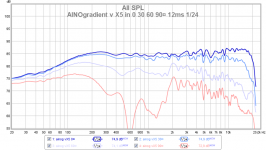
It's all the same FFT size, 65536 points, and the "data resolution" is better than 2Hz in this case. It's all with reflections excluded, as the first reflection comes a little before 5 ms, so you would say the lower limit here is 240Hz (blue).
Now look at the red curve, which is gated so the "lower limit" is 800Hz. See how much more smoothed it is above this frequency. The green line is for the lower limit of 2kHz just for extreme. It basically shows very little above 2 kHz compared to the blue one. The thing is that these are not only the lower limits, they are basically also the available resolution of the data.
If I had bigger reflection-free space available to make the gate longer than 5 ms, it would be still more "detailed", than the blue curve shown, of that I'm quite convinced but I can't really know unless I really do it.
If you don't call this smoothing, then I don't know how to call it.
No one really said it's interpolation. Just 'making up the data' may be the better term. Even the points forming the green line here are spaced less than 2 Hz. It is not the resolution of the green frequency response data, is it.
Last edited:
Yes but as this in not anechoic data it cannot be proved if these modifications came from reflexions or not.
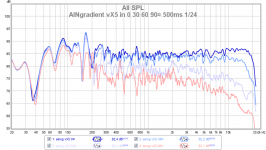
Here is my take on it: I generated using rephase the impulse of a minimum-phase constant Q +6dB PEQ at 4kHz, Q=40.
There are of course no reflexion in this impulse and it can be compared to a purely anechoic measurement.
Loaded into HOLM, blue is raw, red is gated at 500Hz (3 octaves lower).
I also did the same test with zeroing "by hand" and obtain similar results.
Attachments
I am poor at mathematics, and I use mainly REW. However with it I can easily play with different gating and gate type. So, I am not concerned about FFT mathematics, but the end result.
There was discussion about loosing resolution with high Fq with long gate. I can't see this, only the effect of various reflections and room modes.
There was discussion about loosing resolution with high Fq with long gate. I can't see this, only the effect of various reflections and room modes.
Attachments
With a 12ms gating you are down to a 83Hz resolution (1/0.012), but on the other hand you are also using 1/24 octave smoothing on both of your measurements, which gives a factor of 1.029 between two points (2^(1/24)).
With this smoothing you have a maximum 2.9Hz resolution at 100Hz, 29Hz at 1kHz, and 290Hz at 10kHz...
83Hz resolution is obtained at approx 2844Hz
( 1/0.012 / (2^(1/24) -1) )
So the fact that no difference is apparent in the HF is simply due to your octave smoothing giving a lower resolution than the 12ms gating above ~2844Hz.
Last edited:
In his book, Toole speaks about this issue on page 382. At low frequencies, he says that anechoic measurement gives better details than gated measurement. He gives an example.
Here is my take on it: I generated using rephase the impulse of a minimum-phase constant Q +6dB PEQ at 4kHz, Q=40.
You can clearly see that with a Q of 40 the impulse is still ringing out beyond the gate. This is truncation and the cause of your "smoothing".
All FFTs do some smoothing depending on the data length. The question is if the data length sufficient such that the FFT smoothing is not too severe. 5Hz smoothing is not going to be an issue.
Sure, but that means 200ms of reflection-free time data. Not 5 or 10ms.5Hz smoothing is not going to be an issue.
Should and can the gaussian blend be turned off?The data above the cutoff does not change unless new reflection enter the window.
"your octave smoothing giving a lower resolution than the 12ms gating above ~2844Hz. "
Yes, but who actually needs more precision? If, just use shorter gate an no smoothing. Different gate types have actual meaning only with short gates, according to my tests.
Anechoid is needed to see bass driver range clearly, but that can be done with nearfiel very easily too. Anechoid response on a stand is never valid when speaker is placed in room environment...
So the question is what setup, gating etc. we are focused on. My point is that we must do several different measurements and do some brainwork to make synthesis of them. The "real performance" can not be presented in asingle measurement or graph!
In his book, Toole speaks about this issue on page 382. At low frequencies, he says that anechoic measurement gives better details than gated measurement. He gives an example.
I doubt anyone would argue; but Mr. Toole has an anechoic chamber at his disposal, and few of us here do.
Having thought about this some more the situation is clearer.
First we need to go back and recall how any transfer function can be modeled as a set of poles and zeros. The poles have an infinite impulse response, but the zeros have a finite impulse response. Now let's consider an impulse response and what happens if we truncate it. First if there are only zeros that terminate before the truncation then there is no effect whatever. This means that nulls in the response need not have any effect from a truncation and in fact extending the impulse response with zeros does increase the resolution indefinitely. In this case there is no smoothing or effect of truncation at all. Thus one cannot say that in general there is always smoothing due to a window because nulls need not be smoothed at all.
Now there is the case of a pole, or a peak in the response. These always have an infinite impulse response and hence the impulse response from these will always be truncated to a greater or lessor extent and so there will always be the effect of the window of lowering the Q of a resonance. How this happens is very dependent on how the window is shaped. Hence if a peak is affected, but a null is not affected one cannot call this "smoothing" - "smoothing" in the classical sense simply does not happen.
Since the decay of a pole is exponential the effect of truncation is not linear, which means that truncation at 5 ms is not twice as much of an effect as it is at 10 ms. The effect could be large at 5 ms and completely negligible at 10 ms. Hence the effect on resolution cannot be said to be proportional to the window length.
So while there is an effect from a window, it is neither smoothing nor a lowering of resolution. It is something else. Clearly if the impulse has sufficiently decayed before the window is applied then the effect of the window is negligible. It is simply not the case that a 5 ms. window has a 200 Hz resolution across the bandwidth of the data. That is completely wrong.
The bottom line is that one needs to insure that there is enough decay of the impulse response such that the window does not adversely affect the data. This is not that hard to do, but one does have to be careful.
And let's not forget that there are techniques of extending the impulse response that completely circumvent all of the problems being described here. As with any measurement technique, windowing is not an issue if done properly, and it is completely wrong if done incorrectly.
Last edited:
The "real performance" can not be presented in a single measurement or graph!
Not a single measurement perhaps, but certainly I can combine techniques into a single graph. This is done all the time.
Please let me ask in another way.
Regardless of actual data, let's move through the steps taken during the frequency response calculation:
1) Take impulse response with say 48kHz sampling rate.
2) As there is only 5 ms of reflection-free time, only first 240 samples are used.
3) Without any zero padding, if fed directly to an FFT, it gives say 120 frequency data samples that are spaced 200Hz apart. So far these are basic facts.
First question: What is the resolution of this 120 data points?
4) Now 3760 zeroes are added to the previous 240 samples for total 4000 samples.
This is fed again to an FTT that returns 2000 frequency points now spaced at 12Hz.
Second question: Is there a higher information content in these 2000 points?
If so, where does this new information come from?
I say that the previous data of 120 points carry all the information actually available. How can this be made more detailed or informative just by adding artificial numbers?
Thank you.
Please let me ask in another way.
Regardless of actual data, let's move through the steps taken during the frequency response calculation:
1) Take impulse response with say 48kHz sampling rate.
2) As there is only 5 ms of reflection-free time, only first 240 samples are used.
3) Without any zero padding, if fed directly to an FFT, it gives say 120 frequency data samples that are spaced 200Hz apart. So far these are basic facts.
First question: What is the resolution of this 120 data points?
4) Now 3760 zeroes are added to the previous 240 samples for total 4000 samples.
This is fed again to an FTT that returns 2000 frequency points now spaced at 12Hz.
Second question: Is there a higher information content in these 2000 points?
If so, where does this new information come from?
I say that the previous data of 120 points carry all the information actually available. How can this be made more detailed or informative just by adding artificial numbers?
Thank you.
First, I'd like to say that your last example using the figures from HOLM is a very poor one, Mbat. You are in effect truncating part of the initial impulse, so there is no surprise that there are changes to the resulting frequency response.
The same thing applies to you, POS, in your post. You have truncated the impulse representing the EQ peak, and this will for certain cause changes in the frequency domain.
Let's face it, if the first reflection contaminates the impulse from the loudspeaker before it dies out, you don't have much hope of recovering all the information since you will be throwing some out with the reflection and beyond.
I believe that what Earl is talking about is the case when the majority of the impulse from the loudspeaker occurs before the first reflection is observed. At some low frequency this requirement can no longer be met. But by replacing the data with zeros you are approximating the impulse response, with a good representation of the high frequency part and a very bad (e.g. none) representation of the low frequency part.
Let me illustrate: Assume that there is no reflection, and the measurement was taken in "space" with no boundaries nearby. The impulse starts out the same, no? At the time where the first reflection would appear for an in-room measurement the "in space" impulse just continues dying off to zero. We can approximate this with measurements in our real world spaces by zeroing the impulse starting at the first reflection. The only difference would be the error in the low frequency region where we are not correctly capturing the "dying out" tail of the impulse, but this is already a well known that has been mentioned many times in this thread.
It may seem peculiar, but Earl is correct in what he is saying. Padding with zeros IS adding more information in this case: by approximating the impulse tail with zeros you are adding information. In this case the information added is a pretty good representation/approximation of what the real impulse is actually doing, just not for low frequencies, so we are in effect only adding "high frequency" information. As a result, the low frequency limit below which the data is nonsense has not been changed, but the frequency resolution is increased for all frequencies above the cutoff. A real impulse taken in space would eventually die off to zero and continue that way forever, and this is the model for approximating the long time impulse response.
-Charlie
- Status
- Not open for further replies.
- Home
- Loudspeakers
- Multi-Way
- Uniform Directivity - How important is it?