mabat,
That seem to be that question, what is real data? More measuring points means finer scale of resolution and how can it be anything else. It seems you are questioning FFT measurement accuracy as related to an actual event. What do you want, analog strip chart recording?
That seem to be that question, what is real data? More measuring points means finer scale of resolution and how can it be anything else. It seems you are questioning FFT measurement accuracy as related to an actual event. What do you want, analog strip chart recording?
Real data = true anechoic data
Gated data = smoothed real data
It's simple as that. I'm totally with Markus on this.
- If I feed FFT algorithm with say 1000 data points, it returns me another 1000 data points (let's make it simple). If I know from my sampling rate that these points cover the 20kHz bandwidth, I know that between each of these data points is 20Hz. Is this my measurement resolution? Of course not. I didn't even mention what data I fed in.
Now if I use 4000 points (add 3000 zeroes), the points will be 5Hz apart but the situation hasn't changed at all.
- And if frequency response doesn't change much when the gate is being changed, it only means that the nature of the measured system is such that it doesn't matter much if it's smoothed within 200Hz or 100Hz band (or whatever)... But it is smoothed anyway.
Last edited:
May I offer another alternative?
I dug up this old web page about editing the impulse response, written by John Kreskovsky:
Matched Filters
In his approach, you measure the impulse response and then replace the data for times greater than when the first reflection appears with an impulse response generated using a Thiele-Small box model of the driver.
If one was just measuring the driver response, not the system response, I think this technique would work better than zeroing the impulse response after the first reflection appears. In the latter part of the web page, John talks about some complications that can arise. I think as long as the baffle step can be captured in the impulse prior to the first reflection, this approach could work well.
It actually is true that the resolution can be increased at will just by padding with zero's up to any point that you want.
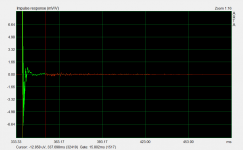
Adding zeros to the impulse means making up data (zeros in that case) that might or might not represent reality. It's an assumption how the impulse will look like without actually measuring it.
Last edited:
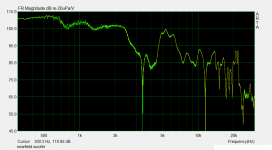
How about all you smart guys explain an example? 😉 Here is a nearfield measurement I just took. One graph compares response for windows of about 6.8ms and 15.5ms. The other compares to maximum window (344 ms) in a larger range.
Attachments

😕 That is what gating is all about...Adding zeros to the impulse means making up data (zeros in that case) that might or might not represent reality. It's an assumption how the impulse will look like without actually measuring it.
How about all you smart guys explain an example? 😉 Here is a nearfield measurement I just took. One graph compares response for windows of about 6.8ms and 15.5ms. The other compares to maximum window (344 ms) in a larger range.
Yes, nearfield data is to a large degree free of room effects. The problem is that the near field response changes significantly with distance hence the near field data doesn't represent a speaker's real behavior.
This all boils down to how the Fourier Transform works. Zero padding and the cyclic nature of the Fast Fourier Transform is explained wonderfully in Joe D'Appolitto's book.
Basically, the FFT is cyclic over the period of the fundamental frequency. If your gate time is 5 ms, that is a fundamental frequency of 200 Hz. That means the output will only be at 200 Hz intervals. Through zero padding you can make your curve look smoother, but there is no real data between 200 Hz and 400 Hz, and so on.
It's like saying the cost of one potato is $1 and that of a 100 is $100. If you assume a linear relationship, then you can join the points of $1 to $100, and be able to say the cost of 50 potatoes is $50. But there is no real data for the cost of 50 potatoes. The cost of 50 potatoes may be different than what a linear relationship might predict.
Markus is spot on. Charlie's suggestion might be worth investigating though.
Last edited:
That was not at all the point. You guys are all talking about how much data is represented with gating, there's some data and some gating.Yes, nearfield data is to a large degree free of room effects. The problem is that the near field response changes significantly with distance hence the near field data doesn't represent a speaker's real behavior.
😕 That is what gating is all about...
The point was that gating an impulse response reduces frequency resolution in a derived magnitude response. Adding "silence" (zeros) to the response doesn't increase frequency resolution.
That was not at all the point.
Then I don't understand what you're trying to show with those graphs.
I wasn't trying to show anything, I was just trying to provide something to talk about, so that someone could say "but if you do this, then you will see ____", and then I could do that, and we could see. Apparently my interface will only let me do 44.1, 48, and 96, though, so I can't sample at 16k or anything.Then I don't understand what you're trying to show with those graphs.
^ Again, sample rate has nothing to do with frequency resolution of a magnitude response curve derived from a gated impulse response.
This all boils down to how the Fourier Transform works. Zero padding and the cyclic nature of the Fast Fourier Transform is explained wonderfully in Joe D'Appolitto's book.
Basically, the FFT is cyclic over the period of the fundamental frequency. If your gate time is 5 ms, that is a fundamental frequency of 200 Hz. That means the output will only be at 200 Hz intervals. Through zero padding you can make your curve look smoother, but there is no real data between 200 Hz and 400 Hz, and so on.
It's like saying the cost of one potato is $1 and that of a 100 is $100. If you assume a linear relationship, then you can join the points of $1 to $100, and be able to say the cost of 50 potatoes is $50. But there is no real data for the cost of 50 potatoes. The cost of 50 potatoes may be different than what a linear relationship might predict.
Markus is spot on. Charlie's suggestion might be worth investigating though.
I guess my next question would be HOW is the algorithm interpolating in between points in the frequency domain? For instance, if my 5ms gate gives a minimum frequency of 200Hz, then why am I getting data out in between 200Hz and 400Hz and how is that generated?
It seems that there is a low end artifact most times - e.g. the response doesn't just roll off in a maximally flat way, but does "something else" and this also corrupts the accuracy of the data just above (e.g. 200Hz-500Hz) the minimum frequency.
And why does the low end behave like it does, with the "upturned tail" look to it?
Last edited:
And I was only saying I'm not able to demonstrate that to be true below 44.1k because my hardware won't do it. I'm not claiming to have a strong handle on FFT stuff, so I'm not in this discussion to educate anyone. You do understand the concept of examples, right? 😉^ Again, sample rate has nothing to do with frequency resolution of a magnitude response curve derived from a gated impulse response.
It does only look like 1 data point in that range on my screen.For instance, if my 5ms gate gives a minimum frequency of 200Hz, then why am I getting data out in between 200Hz and 400Hz and how is that generated?
And I was only saying I'm not able to demonstrate that to be true below 44.1k because my hardware won't do it. I'm not claiming to have a strong handle on FFT stuff, so I'm not in this discussion to educate anyone. You do understand the concept of examples, right? 😉
You're using ARTA, right? The manual goes into great detail explaining the topic at hand:
http://www.artalabs.hr/download/ARTA-user-manual.pdf
I think Earl's example of a gated anechoic measurement in post #589 is clear enough: do you expect to see any loss in resolution in the HF when zeroing samples after a few ms? If you do then it just mean that it was not an anechoic measurement.The point was that gating an impulse response reduces frequency resolution in a derived magnitude response. Adding "silence" (zeros) to the response doesn't increase frequency resolution.
I think Earl's example of a gated anechoic measurement in post #589 is clear enough: do you expect to see any loss in resolution in the HF when zeroing samples after a few ms? If you do then it just mean that it was not an anechoic measurement.
1) The problem is low(er) frequencies
2) Earl doesn't have an anechoic chamber at his disposal
1- is the single and well known limitation of gated measurements
2- is the reason why one would use gated measurements in the first place
2- is the reason why one would use gated measurements in the first place
The problem is that the result of FFT doesn't goes like 0, 200Hz, a then any resolution at will by zero padding.1- is the single and well known limitation of gated measurements
2- is the reason why one would use gated measurements in the first place
It really goes like 0, 200, 400, 600 Hz,... for 5 ms gate.
By zero padding you just interpolate (well, not really, it's just smoothed).
See the difference? You have only very sparse data up to about 1kHz for 5 ms gate. That's the real pain - or can be. It doesn't have to be a problem if the system is itself smooth enough. But how you know? Surely not from gated data.
Nearfield will help up to about 200 - 400Hz, depending on the source size. This still leaves the band up to 1 kHz somewhat sparse however.
Last edited:
- Status
- Not open for further replies.
- Home
- Loudspeakers
- Multi-Way
- Uniform Directivity - How important is it?