Unfortunately the curve tracer doesn't seem to work very well with Windows 8 but I'm guessing an update will come out eventually that will fix the problem. I love it so I am keeping my win 7 laptop alive to run it 😉)
Maybe you need to get the updated USB driver (there is a Win8 update on the site)
The the latest pl2303 driver for win8 is only suit pl2303HXD chip,
But i use pl2303hx, So you need use the 1.50 version driver, and you must no allow window8 auto update to the latest driver version.
The curve software on yahoo group is the latest version.
http://uk.dir.groups.yahoo.com/group/CurveTracer/
But i use pl2303hx, So you need use the 1.50 version driver, and you must no allow window8 auto update to the latest driver version.
The curve software on yahoo group is the latest version.
http://uk.dir.groups.yahoo.com/group/CurveTracer/
Locky thx Let me try to find out how I can do what you suggest and report back when I get a chance.
I agree. You should also test out the script locky wrote to do the MOSFET characteristic curves (you know Id vs Vds at different Vgs) - I think he's posted it either here or on his yahoo user group.
Unfortunately the curve tracer doesn't seem to work very well with Windows 8 but I'm guessing an update will come out eventually that will fix the problem. I love it so I am keeping my win 7 laptop alive to run it 😉)
kasey197 unfortunately I did not find it.....😡
Locky_z please tell me if I have tracer #305 as written on the back or possibly 302 as written in your mail......
So I might get exact values ! 🙂🙂
So I might get exact values ! 🙂🙂
305#Locky_z please tell me if I have tracer #305 as written on the back or possibly 302 as written in your mail......
So I might get exact values ! 🙂🙂
Curve Trcer with Windows 8
Locky- I had some time to try this out with Win8 using your suggestion above. It works so far. Here are the steps in case it helps anyone else who wants to use this tracer on a win8 machine.
1) Disable Autoupdate (you can search for Autoupdate under System and select what level of autoupdate you want)
2) Install driver
3) Reboot PC
4) Plug in CT and launch software - it may work for a while then it will say device offline.
5) Unplug CT, reboot
6) Plug CT back in and launch software. After a few min the software will detect the CT and all is good from there.
If i find any major probs I will let you know.
The the latest pl2303 driver for win8 is only suit pl2303HXD chip,
But i use pl2303hx, So you need use the 1.50 version driver, and you must no allow window8 auto update to the latest driver version.
The curve software on yahoo group is the latest version.
CurveTracer : Locky_z's Curve Tracer
Locky- I had some time to try this out with Win8 using your suggestion above. It works so far. Here are the steps in case it helps anyone else who wants to use this tracer on a win8 machine.
1) Disable Autoupdate (you can search for Autoupdate under System and select what level of autoupdate you want)
2) Install driver
3) Reboot PC
4) Plug in CT and launch software - it may work for a while then it will say device offline.
5) Unplug CT, reboot
6) Plug CT back in and launch software. After a few min the software will detect the CT and all is good from there.
If i find any major probs I will let you know.
Here is the link to the post written by Locky which teaches you how to do the FET characteristic curves:
http://www.diyaudio.com/forums/solid-state/151253-diy-curve-tracer-pc-7.html#post3416043
http://www.diyaudio.com/forums/solid-state/151253-diy-curve-tracer-pc-7.html#post3416043
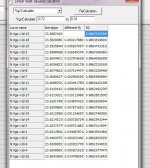
I try to measure only one 2SK170 for 21 times.
As in the attached file, the results are different among 21 measurements.
The error range is too high, so that I wonder whether I made any mistake or not.
As in the attached file, the results are different among 21 measurements.
The error range is too high, so that I wonder whether I made any mistake or not.
I try to measure only one 2SK170 for 21 times.
As in the attached file, the results are different among 21 measurements.
The error range is too high, so that I wonder whether I made any mistake or not.
Heating the same devcice multiple times will cause heat buldup in the fet which could easily cause slight alteration in test.
Forgot 😀
you are kidding right? 😉
The variation is in the avarage range of 0.02% or so, beside like it's been mentioned here, thermal plays a big rule and temperature changes over time and different set up can produce slightly different results too, especially considering that a Jfet is temperature dependent. This tool rocks!
I have it and I think it is a lot of bang for the buck! Easy to use, precise enough, very flexible and very cheap!
😎
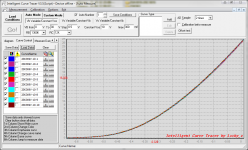
If you want to get the transconductance of a FET.
After you get the Vgs-Id curve, and hold down left mouse button and draw a rectangle.
When you release the button, It will display a menu, there are two menu item.
One is 'V=[xxx-xxx]Calculate' one is 'I=[xxx-xxx]Calculate'
You can select the 'V=[xxx-xxx]Calculate'.
It will display a data window as this:
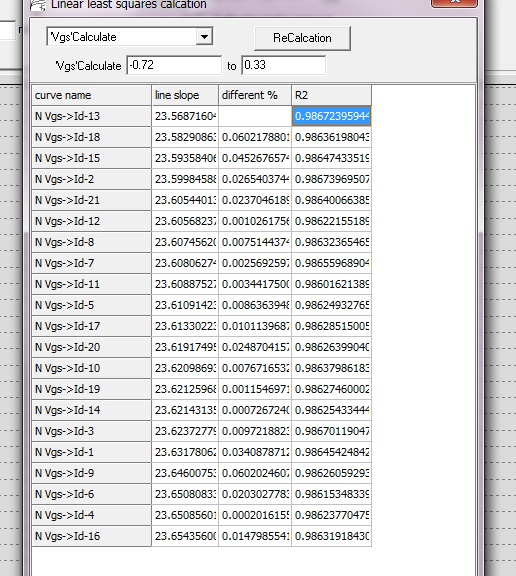
The transconductance display in column of 'line slope'. and it also sorted.
Its units depend on your X-axis and Y-axis unit, if the Y axis is the mA, then it is measured in ‘ms’, if the Y-axis unit is A, then its units of ‘S’.
The 'different%' mean the 'line slope' value compare with previous 'line slope'.
example: second line,'different%' is 0.06021%
The calcute process is:
(23.5829-23.5687)/23.5687*100%=0.0602%
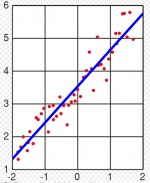
This calcuate use 'linear least squares' to get a straight line
y=a*x+b
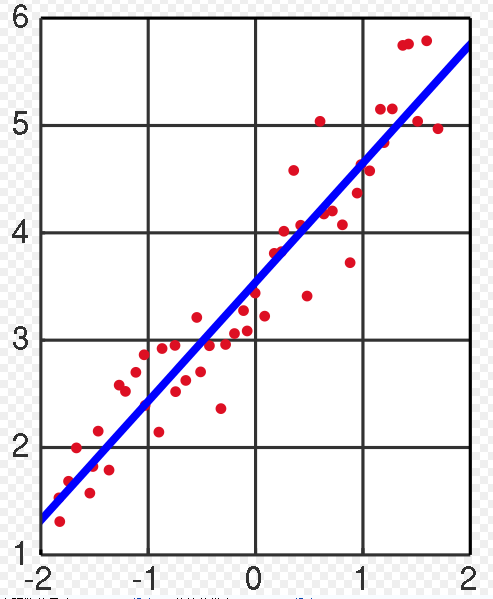
Here 'a' is the transconductance. and show it in column 'line slope'.
The R2 is 'product-moment correlation coefficient '. It is closer to 1, then the original curve closer to a straight line.
You can change the calcuate range,you will get different line slope.
You can refer to wiki
Simple linear regression - Wikipedia, the free encyclopedia
After you get the Vgs-Id curve, and hold down left mouse button and draw a rectangle.
When you release the button, It will display a menu, there are two menu item.
One is 'V=[xxx-xxx]Calculate' one is 'I=[xxx-xxx]Calculate'
You can select the 'V=[xxx-xxx]Calculate'.
It will display a data window as this:
The transconductance display in column of 'line slope'. and it also sorted.
Its units depend on your X-axis and Y-axis unit, if the Y axis is the mA, then it is measured in ‘ms’, if the Y-axis unit is A, then its units of ‘S’.
The 'different%' mean the 'line slope' value compare with previous 'line slope'.
example: second line,'different%' is 0.06021%
The calcute process is:
(23.5829-23.5687)/23.5687*100%=0.0602%
This calcuate use 'linear least squares' to get a straight line
y=a*x+b
Here 'a' is the transconductance. and show it in column 'line slope'.
The R2 is 'product-moment correlation coefficient '. It is closer to 1, then the original curve closer to a straight line.
You can change the calcuate range,you will get different line slope.
You can refer to wiki
Simple linear regression - Wikipedia, the free encyclopedia
Attachments
- Home
- Vendor's Bazaar
- Intelligent Curve Tracer 3.0 release