You can select menu 'option->config'
Select 'Relay and resistor define',
Set RB0 value(ohm) as 500
Set RB1 value(ohm) as 6000
Set RB2 value(ohm) as 91000
Set RB3 value(ohm) as 1360000
Set RC0 value(ohm) as 4.55
Set RC1 value(ohm) as 75
Set RC2 value(ohm) as 1000
Set RC3 value(ohm) as 12000
and press save.
but all the 'b7'~'b0' don't change,
Locky_Z. First I want to say that I have enjoyed having this tool immensely. While learning to use it I am also learning a lot more about transistors, JFETS etc. I have a few questions, however.
1) What is meant by 'No Fix' (e.g Vbe->Ic (Fix Vce) or Vbe->Ic (Vce No Fix) in the conditions? I have found that whenever I 'Load' one of the conditions that includes 'No Fix', I get precisely one point on the curve. Is that supposed to be the case? What does No Fix mean? I have been assuming that it means, for example that Vce is not held constant, i.e. it is not fixed. But why does it cause me to only get one point in my curve?
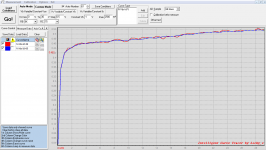
2) The attached curve shows a 'Vds-Id' curve for a 2N5457 NJFET. The red curve shows the results for the two AD sample setting while the blue (smoother curve) shows the curve for the 66 AD sample setting. I obtained similar results for all of the other 2N5457's I had on hand. Mostly I get nice smooth curves using the two AD sample setting for all of the other NJFETs I have tested. Can you suggest why I get less smooth curves for just the 2N5457s?
3) Finally-and this is very minor- I am a little confused by some of the nomenclature in the program. I was always taught that, by convention, the first parameter referred to in the name of a graph is the Y-axis (the ordinate) and the second term is the X-axis (the abscissa). You seem to follow this convention in some places, for example in the left window under Curve Control for the 'Hfe-Ic' curve. But not others in this window and not in the Load Conditions drop down window. Am I reading this wrong? One way to help mitigate potential confusion would be to label the axes. In fact, it would be helpful if there were some ability to label the displayed curves in the program. Better yet, it would be truly helpful if there was an option to allow the program to automatically label the curves, say for the type of transistor, or Ib, etc.
This is an absolutely wonderful tool. Thanks for designing it and making it available for purchase
1) What is meant by 'No Fix' (e.g Vbe->Ic (Fix Vce) or Vbe->Ic (Vce No Fix) in the conditions? I have found that whenever I 'Load' one of the conditions that includes 'No Fix', I get precisely one point on the curve. Is that supposed to be the case? What does No Fix mean? I have been assuming that it means, for example that Vce is not held constant, i.e. it is not fixed. But why does it cause me to only get one point in my curve?
2) The attached curve shows a 'Vds-Id' curve for a 2N5457 NJFET. The red curve shows the results for the two AD sample setting while the blue (smoother curve) shows the curve for the 66 AD sample setting. I obtained similar results for all of the other 2N5457's I had on hand. Mostly I get nice smooth curves using the two AD sample setting for all of the other NJFETs I have tested. Can you suggest why I get less smooth curves for just the 2N5457s?
3) Finally-and this is very minor- I am a little confused by some of the nomenclature in the program. I was always taught that, by convention, the first parameter referred to in the name of a graph is the Y-axis (the ordinate) and the second term is the X-axis (the abscissa). You seem to follow this convention in some places, for example in the left window under Curve Control for the 'Hfe-Ic' curve. But not others in this window and not in the Load Conditions drop down window. Am I reading this wrong? One way to help mitigate potential confusion would be to label the axes. In fact, it would be helpful if there were some ability to label the displayed curves in the program. Better yet, it would be truly helpful if there was an option to allow the program to automatically label the curves, say for the type of transistor, or Ib, etc.
This is an absolutely wonderful tool. Thanks for designing it and making it available for purchase
Attachments
Locky_Z. First I want to say that I have enjoyed having this tool immensely. While learning to use it I am also learning a lot more about transistors, JFETS etc. I have a few questions, however.
1) What is meant by 'No Fix' (e.g Vbe->Ic (Fix Vce) or Vbe->Ic (Vce No Fix) in the conditions? I have found that whenever I 'Load' one of the conditions that includes 'No Fix', I get precisely one point on the curve. Is that supposed to be the case? What does No Fix mean? I have been assuming that it means, for example that Vce is not held constant, i.e. it is not fixed. But why does it cause me to only get one point in my curve?
2) The attached curve shows a 'Vds-Id' curve for a 2N5457 NJFET. The red curve shows the results for the two AD sample setting while the blue (smoother curve) shows the curve for the 66 AD sample setting. I obtained similar results for all of the other 2N5457's I had on hand. Mostly I get nice smooth curves using the two AD sample setting for all of the other NJFETs I have tested. Can you suggest why I get less smooth curves for just the 2N5457s?
3) Finally-and this is very minor- I am a little confused by some of the nomenclature in the program. I was always taught that, by convention, the first parameter referred to in the name of a graph is the Y-axis (the ordinate) and the second term is the X-axis (the abscissa). You seem to follow this convention in some places, for example in the left window under Curve Control for the 'Hfe-Ic' curve. But not others in this window and not in the Load Conditions drop down window. Am I reading this wrong? One way to help mitigate potential confusion would be to label the axes. In fact, it would be helpful if there were some ability to label the displayed curves in the program. Better yet, it would be truly helpful if there was an option to allow the program to automatically label the curves, say for the type of transistor, or Ib, etc.
This is an absolutely wonderful tool. Thanks for designing it and making it available for purchase
‘Fix Vce’ mean 'constant Vce'.1) What is meant by 'No Fix'
In 'Fix Vce' mode,,the program will auto adjust the C channel output and make the vce constant.
In other mode, the program only make C channel output constant,When Ic change,the Vrc(voltage drop of RC) is changed,so the Vce is changed, not constant.
Your 'Ic' is too small, it only 0.44mA,you need to use RC=1K or RC=12K,2) The attached curve shows a 'Vds-Id' curve for a 2N5457 NJFET. The red curve shows the results for the two AD sample setting while the blue (smoother curve) shows the curve for the 66 AD sample setting. I obtained similar results for all of the other 2N5457's I had on hand. Mostly I get nice smooth curves using the two AD sample setting for all of the other NJFETs I have tested. Can you suggest why I get less smooth curves for just the 2N5457s?
Because the measurement accuracy or noise is about 2 ~ 5 mV, if you use RC=75,the Vrc only 33mV, If you choice RC=1K or RC=12K,then VRC will be 440mV or 5.3V, the accuracy is more than RC=75. The curve will be more smooth.
I have no the regulate of curve name. this is my mistake.3)One way to help mitigate potential confusion would be to label the axes. In fact, it would be helpful if there were some ability to label the displayed curves in the program. Better yet, it would be truly helpful if there was an option to allow the program to automatically label the curves, say for the type of transistor, or Ib, etc.
In Version 3.5, It allow user define the axis label display, But it is not automatically label , It need to manually set.
Thanks Locky_Z. That is very helpful.
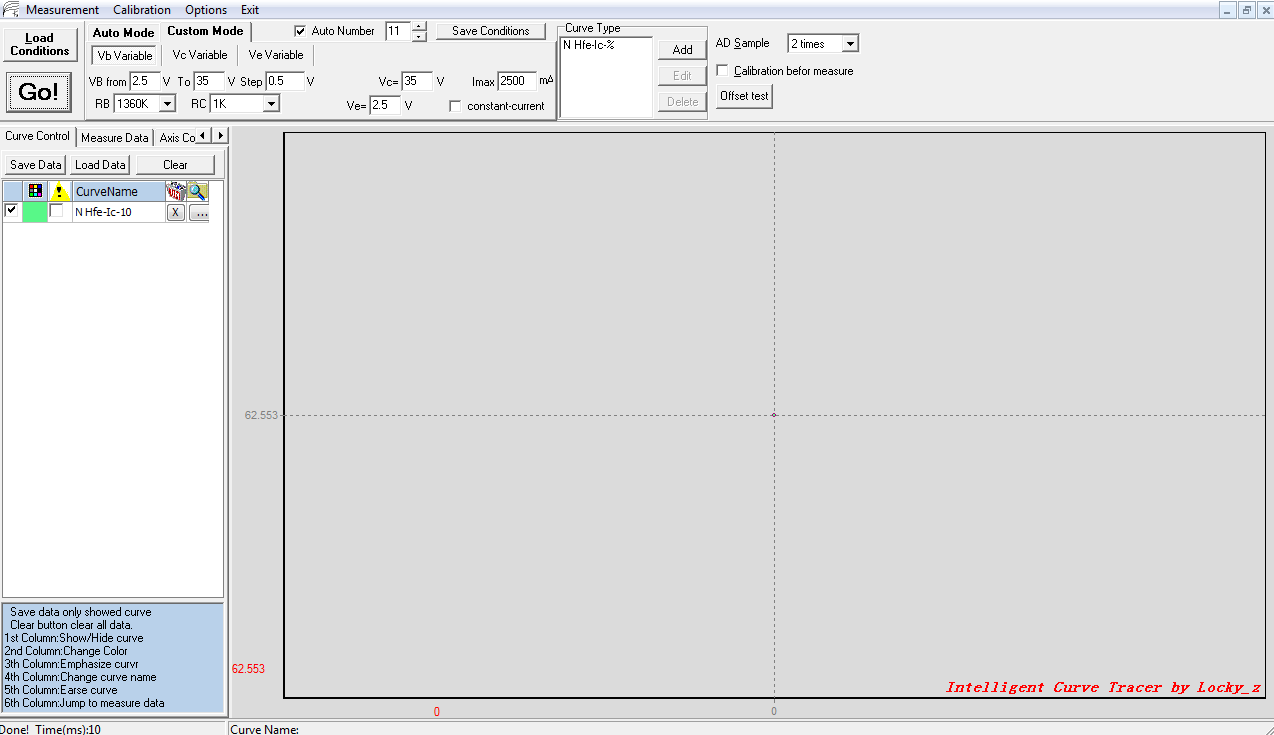
But should I get only one point in my curve as shown below?
1) What is meant by 'No Fix' (e.g Vbe->Ic (Fix Vce) or Vbe->Ic (Vce No Fix) in the conditions? I have found that whenever I 'Load' one of the conditions that includes 'No Fix', I get precisely one point on the curve. Is that supposed to be the case? What does No Fix mean? I have been assuming that it means, for example that Vce is not held constant, i.e. it is not fixed. But why does it cause me to only get one point in my curve
But should I get only one point in my curve as shown below?
Attachments

I had the same problem until I put channel gains in the config menu. To Locky: Please make in the next version autoscroll list of curves while adding a new result. I was measuring about 400 transistors and it was uncomfortable to scroll every time.But should I get only one point in my curve as shown below?
Thanks Locky_Z. That is very helpful.
But should I get only one point in my curve as shown below?
What is your supply voltage?
The software control B/C/E channel power amplifier output voltage what you set, and measure them.
When it measured voltage(Vbh/Vch/Ve) is between you set value-2V ~ value+2V, the software consider the B/C/E channel amplifier is OK. if not, it conside power amplifier is failure, then stop to run.
From your picture,the vc is 35V,If your power supply voltage is less 35V, the power amplifier can output more than 35-2=33V, the software consider the power amplifier is failure,and stop.
If the parameter in ini file is error,example the gain is error, you want to output 30V, but the gain parameter error,so the output is less, the software measure them, consider the ampfilier is error,so stop.
You mean auto jump to the last curve data table?Please make in the next version autoscroll list of curves while adding a new result. I was measuring about 400 transistors and it was uncomfortable to scroll every time.
or
Auto highlight the last curve ?
Auto jump in data table. I measured the transistors in TO-92 and used the adapter from the connector PLD. Sometimes gets a bad connection and I needed to delete the last measurement.You mean auto jump to the last curve data table?
Again big Thanks. In fact my power supply was at just a little over 34 volts. As I learn to use the instrument, I have just been using the default settings, including the 35V load condition. Resetting Vc to 34 allowed me to get a normal (many points) measurement.
This leads to another question, however, for anyone who can explain this to me. Is it normal for the measured Hfe to vary so much using the fixed versus no fix condition? For an old PNP small signal Darlington I get about 300 for the fixed condition versus about 500 for the unfixed condition (which coincidentally corresponds to a static DC measurement I made with a DMM).
I am looking forward to Version 3.5 of the software.
Darlington hfe change is very big, this is the true facts.
You can goto
CurveTracer : Locky_z's Curve Tracer
and download V3.5(2012.8.12)
You can goto
CurveTracer : Locky_z's Curve Tracer
and download V3.5(2012.8.12)
Power Supply for CT3
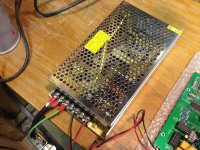
I found a power supply for the CT3 that I like and that seems to work well-36V/4.2 A. Price was good (cheaper than what it would have cost me to build an equivalent linear supply). 36V 4.2A Single Output Power Supply
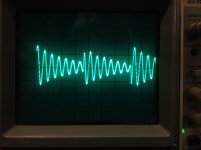
Noise is a little high compared to the linear supply I had wired up (see the scope photo-settings 50 mV/div and 5uS per div) but I think the frequency of the noise is high enough that it doesn't much matter-which brings me to my question-does it matter? It would be relatively simple to clean it up, but I am not so sure that the effort is warranted. Comments from the experts would be much appreciated.
Thanks.
I found a power supply for the CT3 that I like and that seems to work well-36V/4.2 A. Price was good (cheaper than what it would have cost me to build an equivalent linear supply). 36V 4.2A Single Output Power Supply
Noise is a little high compared to the linear supply I had wired up (see the scope photo-settings 50 mV/div and 5uS per div) but I think the frequency of the noise is high enough that it doesn't much matter-which brings me to my question-does it matter? It would be relatively simple to clean it up, but I am not so sure that the effort is warranted. Comments from the experts would be much appreciated.
Thanks.
Attachments
This switching power supply no problem.
I compared the linear power supply and switching power supply, there is no difference.
I compared the linear power supply and switching power supply, there is no difference.
LockyZ,
I was testing some mosfets today and got a pop and now LED over current light is on. Any ideas. I don't want to have to go this thing bit by bit.
I was testing some mosfets today and got a pop and now LED over current light is on. Any ideas. I don't want to have to go this thing bit by bit.
"got a pop" mean you hear a 'pop' sound? or a popup a window?LockyZ,
I was testing some mosfets today and got a pop and now LED over current light is on. Any ideas. I don't want to have to go this thing bit by bit.
The protect circuit as below:
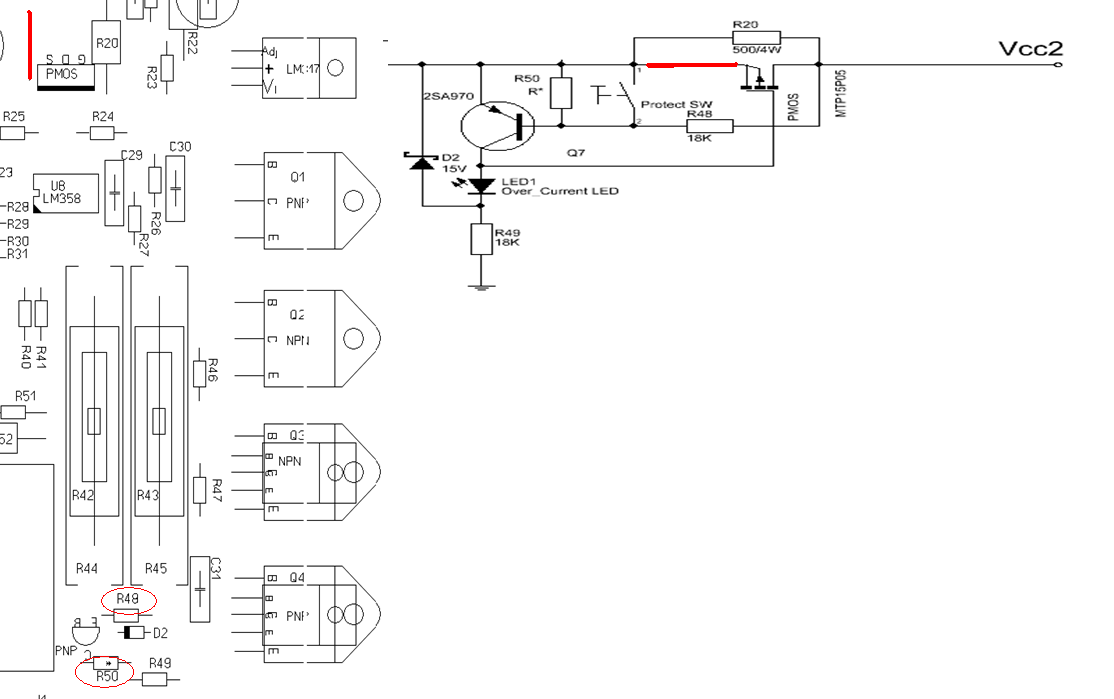
Vcc is power supply input,and output to C/E channel amplifier(Vcc2).
If C/E channel amp have something wrong, or PMOS fail, the over current LED will light.
1.You can measure the voltage of Vcc2 (Vcc2 is Q2 Q3 collector), It is equal to power supply.
2.If Vcc2 is not equal power supply, then Q1~Q4 have some wrong.
3.If Vcc2 is OK, then use a 1K resistor connect Vcc2 and GND and measure the Vcc2 voltage. Normaly Vcc2 voltage drop is small. If PMOS is fail, the Vcc2 vlotage drop down a lot.
4.If Vcc2 is OK, but over current LED still light, then may be Q7 error.
You can check whether Q1-Q4 is short.
or use a 1K resistor connect Vcc2 and GND and measure the Vcc2 voltage. If PMOS is fail, the vlotage of Vcc2 is
Just by these graphics is not easy to see what happens.
Best given your save file (. Cuv), and your measure condition and the power supply voltage.
By these file, I can either reproduce graphics, and data can be analyzed.
Best given your save file (. Cuv), and your measure condition and the power supply voltage.
By these file, I can either reproduce graphics, and data can be analyzed.
- Home
- Vendor's Bazaar
- Intelligent Curve Tracer 3.0 release