Hi, David!
Rambler works very bad last time 🙁 But no matter.
Of course I speak about transmission lines and hybrid loudspeakers. Right designed horns don't need to be filled - It's true!
Hornresp very well and exact calculates the TL's! For full happiness missing only two things - ability to simulate offset port and losses by filling in channel of transmission (labirynth).
Thank you for replies! Alexander.
Hi Alexander,
That is very strange - normally I get a Postmaster message back advising me if an e-mail I send is not delivered successfully. I had "replied" to the question you asked, so my response should have gone direct to your 'rambler' address. I make a point of answering every e-mail I receive from Hornresp users - even when I know my reply may not be what they were hoping to hear 🙂.
Rambler works very bad last time 🙁 But no matter.
It is highly unlikely that Hornresp will ever allow acoustic filling in the horn. While it might be okay for transmission line type speakers, as far as I am concerned it has no place in a well-designed horn system - artificially introducing a loss in the acoustic path seems to defeat the whole purpose of the exercise 🙂.
Kind regards,
David
Of course I speak about transmission lines and hybrid loudspeakers. Right designed horns don't need to be filled - It's true!
Hornresp very well and exact calculates the TL's! For full happiness missing only two things - ability to simulate offset port and losses by filling in channel of transmission (labirynth).
Thank you for replies! Alexander.
Of course I speak about transmission lines and hybrid loudspeakers.
Hi Alexander,
I assume you are aware of the following new simulation program? It seems to allow filling / stuffing to be specified.
http://www.diyaudio.com/forums/subw...sion-line-modelling-software.html#post3179499
Kind regards,
David
David, one more question.
Will it be possible in future to simulate compaund horn and BReflex with LeCleach flare front horn?
Will it be possible in future to simulate compaund horn and BReflex with LeCleach flare front horn?
Will it be possible in future to simulate compaund horn and BReflex with LeCleach flare front horn?
Hi Charcoal,
The way that Hornresp has evolved, a massive amount of work would now be required to modify the program to allow other than a parabolic, conical or exponential flare to be specified for the second or front horn in a compound horn design. Unfortunately I am not in a position to undertake such a large re-build of the software.
Kind regards,
David
Hornresp Update 3000-121024
Hi Everyone,
Due to an oversight on my part, under some conditions the phase response chart when printed could be different to the chart displayed on the screen.
This problem has now been fixed.
Kind regards,
David
Hi Everyone,
Due to an oversight on my part, under some conditions the phase response chart when printed could be different to the chart displayed on the screen.
This problem has now been fixed.
Kind regards,
David

Are you referring to the difference in the resonance spike?
Would it be possible that if you matched the horizontal scale, you might see the same amount of details?
Or am I missing your point?
Would it be possible that if you matched the horizontal scale, you might see the same amount of details?
Or am I missing your point?
Hi Mark,
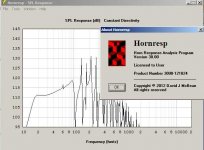
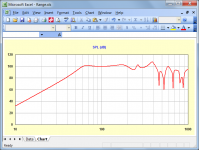
I'm talking about the big spikes around 50-65Hz in the Wizard v. the small blips around 60Hz in the SPL screen. In this particular case it doesn't matter much, but, I thought David would like to see this.
I think both displays should be the same (how do I change the horizontal scale?).
Regards,
I'm talking about the big spikes around 50-65Hz in the Wizard v. the small blips around 60Hz in the SPL screen. In this particular case it doesn't matter much, but, I thought David would like to see this.
I think both displays should be the same (how do I change the horizontal scale?).
Regards,
The graph on the right has a 2 khz bandwidth.
The graph on the left has a 20khz bandwidth.
Might explain the differences.
The graph on the left has a 20khz bandwidth.
Might explain the differences.
Hi Mark,
Yes, I noticed that, and thought that's what you are referring to, but how can I get them to be equal?
Regards,
Yes, I noticed that, and thought that's what you are referring to, but how can I get them to be equal?
Regards,
I think you used to be able to do that. As in customize the graph range. Useful when working with subwoofers. But I can't seem to do it now.
I know that in the wizard if you double click on the bottom part of the graph you can toggle up to the 100 hertz to 20 khz range. That would show you something closer.
I know that in the wizard if you double click on the bottom part of the graph you can toggle up to the 100 hertz to 20 khz range. That would show you something closer.
It is a basic problem.
One graph has a span that is ten times that of the other.
You can get a better view f the low end in the wizard and the top end in the SPL graph.
One graph has a span that is ten times that of the other.
You can get a better view f the low end in the wizard and the top end in the SPL graph.
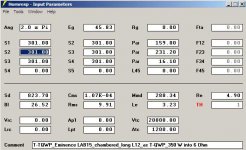
I just ran into a small problem with the response display in the Wizard v. the SPL screen:
Hi Oliver,
Many thanks for this feedback, you have found a bug. It may take me a day or so to track down and fix 🙂.
(Note that double-clicking on the "Frequency (hertz)" label at the bottom of a wizard chart will toggle the frequency range between 10-2000Hz and 100-20000Hz).
Kind regards,
David
Hello David
Would it be possible to make the frequency graph scalable?
As in a user could adjust the scale?
I thought you had that feature at one point, and I found it quite useful in determining resonances in tapped horns and undersized front loaded horns.
Would it be possible to make the frequency graph scalable?
As in a user could adjust the scale?
I thought you had that feature at one point, and I found it quite useful in determining resonances in tapped horns and undersized front loaded horns.
Posts #2955/2956
Hi David,
Thanks for looking into this.
Also, I agree with Mark: being able to scale the graphs would be great. For working with subwoofer enclosures I really don't quite care what's going on above 1kHz in just about all graphs, so maybe a bass/fullrange toggle would be helpful?
Thanks again,
Regards,
... I thought you had that feature at one point ...
You may be thinking of AkAbak, which does have that feature.
Would it be possible to make the frequency graph scalable?
Hi Mark,
The way that Hornresp is structured, it would now require a lot of work to add user-scalable frequency ranges to the charts. Sorry, but it's not going to happen 🙂.
It is of course possible to export the Hornresp chart data, dump it into an existing Excel spreadsheet set up as a template, and adjust the frequency range as required. This can be done reasonably quickly.
Kind regards,
David
Attachments
Thanks for looking into this.
Hi Oliver,
I have found the problem - it will be fixed in the next release.
I am currently working on another change to Hornresp, so it may be a few days before the new version becomes available.
If you are connected to the Internet when Hornresp is started, you will be automatically advised of the update.
Kind regards,
David
- Home
- Loudspeakers
- Subwoofers
- Hornresp