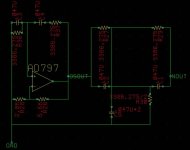
Here is a simple get back to basics example. The textbook Wein bridge oscillator at a modest impedance level ~3.3k and .047uF caps followed by a twin-t at the same impedance level. The singularity at exactly 1kHz is mathematical. This is the noise floor only with one 1nV/1.8pA noise op-amp such as LT1028/AD797 normalized to a 1Hz BW. This sim goes to DC but imagine a low frequency roll off and see how similar it is in spirit to many of the plots here except of course the scaling. IMO the plots with -170-180dB or so noise floor are not physically possible and are due to operator error.
Attachments
Two things about the plots. First the -165 or -170 without a known bandwidth for the bins is only a sort of relative number and not the actual noise density. Second, noise being random means that a single sample could have noise at a number of levels and some averaging would be needed to get a real value of the average or RMS noise level. We don't know how that software does an FFT. The different software packages I use usually have a fat line with as much as +/-10 dB on the first plot that gradually converges to a line at a lower level than the initial peak values. I find I need at least 5 averages to get a meaningful plot. Its possible that Victor's software initially shows just the peak values before averaging.
Yes, absolute values are irrelevant as they depend on the bin size.
What's the point of showing peak values converging to average? I would call that a software bug, if not worse.
P.S. I've showed elsewhere the power of synchronous averaging, using a 16bit 801 points (128 Hz/bin) boat anchor spectrum analyzer with input shorted. -170dB can be obtained without much trouble, that's (in this case) 0.15nV/rtHz. The analyzer input short noise is some 10-12nV/rtHz, so physics is saved, 12nV/SQRT(6400)=0.15nV/rtHz right on spot.
Last edited:
IMO the plots with -170-180dB or so noise floor are not physically possible and are due to operator error.
If the FFT is hig res (128K pts and 48 KHz sample rate) and then the input is at 10 V (an extra 20 dB ref the input) you may be able to get a pretty low apparent noise floor. While its not the noise floor of the oscillator it will help spurii to climb above the noise (or actually push the noise below them).
It's like 4K TV. The ultra high definition does nothing to make actresses look more beautiful but we all want it anyway. . . I'm sure there is now an electronic soft focus effect like the lenses they used to use.
The actress or the 4k TV?
If the FFT is hig res (128K pts and 48 KHz sample rate) and then the input is at 10 V (an extra 20 dB ref the input) you may be able to get a pretty low apparent noise floor. While its not the noise floor of the oscillator it will help spurii to climb above the noise (or actually push the noise below them).
It's like 4K TV. The ultra high definition does nothing to make actresses look more beautiful but we all want it anyway. . . I'm sure there is now an electronic soft focus effect like the lenses they used to use.
Yes, that's fine but not the case here usually, a little bit of worrying about the details helps everyone. Just take the effort to specify every detail of the data presented the tools provide it.
Scott please consider this.
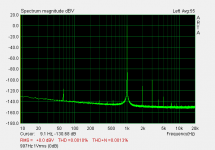
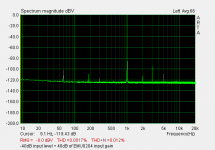
Pic #1 I've input 1Vrms. This is the noise floor of the SVO, a 20k pot used of attenuate the level to 1Vrms (0dBV) and the the EMU0204.
Pic #2 lets suppose I've notched the fundamental to -40dB. The noise floor is about the same.
Pic #3 I've cranked the emu0204 gain pot to add 40dB of gain. The level reads 0dBV and the noise floor has gone up the same 40dB.
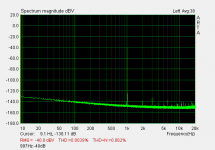
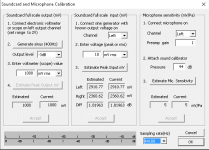
To get the absolute level of harmonics we will have to mentally subtract 40dB from the displayed plot. But I am lazy and want ARTA to provide a direct read of the actual levels. AFAK there is no direct way of re-scaling ARTA's plot. What I do to re-scale ARTA is run the cal at the true input level. In this case -40dBV (10mVrms). I input 10mVrms. Shown in pic #4.
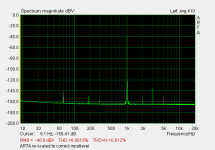
Pic #5 shows the levels after re-scaling ARTA to correct input level. Look at where the noise floor is now. Not correct, but the input level is.
Where would the noise floor be with 60dB, 80dB or 100dB of gain and ARTA re- scaled for each?
Pic #1 I've input 1Vrms. This is the noise floor of the SVO, a 20k pot used of attenuate the level to 1Vrms (0dBV) and the the EMU0204.
Pic #2 lets suppose I've notched the fundamental to -40dB. The noise floor is about the same.
Pic #3 I've cranked the emu0204 gain pot to add 40dB of gain. The level reads 0dBV and the noise floor has gone up the same 40dB.
To get the absolute level of harmonics we will have to mentally subtract 40dB from the displayed plot. But I am lazy and want ARTA to provide a direct read of the actual levels. AFAK there is no direct way of re-scaling ARTA's plot. What I do to re-scale ARTA is run the cal at the true input level. In this case -40dBV (10mVrms). I input 10mVrms. Shown in pic #4.
Pic #5 shows the levels after re-scaling ARTA to correct input level. Look at where the noise floor is now. Not correct, but the input level is.
Where would the noise floor be with 60dB, 80dB or 100dB of gain and ARTA re- scaled for each?
Attachments
Last edited:
. IMO the plots with -170-180dB or so noise floor are not physically possible and are due to operator error.
The FFT process doesnt measure the noise (uncorrelated) floor. But it does give you a window into what is the level of any correlated signal(s) and its level.... even if it is buried below the physical noise floor.
-Richard
Anyway an averaging can little help. Now I can see difference between the two twin T notches. Previously plots was made via the notch built from the RLC polystyrenes. Now the notch built from the Wima FKP2. Without the averaging difference is not seemed:
http://content32-foto.inbox.lv/albums/e/elterra/1kHzAver/1kHzTTWima.jpg
With the averaging 10 times:
http://content32-foto.inbox.lv/albums/e/elterra/1kHzAver/1kHzTTWimaAver.jpg
Software set up (without averaging):
http://content32-foto.inbox.lv/albums/e/elterra/1kHzAver/SoftSet.jpg
The oscillator had run with the max. possible output app 2.8V RMS.
The scale is adjusted at 3kHz. I do not think that may by very big errors in the level readings at this frequency. At the 2kHz app. +4dB must be used for the properly level calculation.
Scott please consider this.
Pic #5 shows the levels after re-scaling ARTA to correct input level. Look at where the noise floor is now. Not correct, but the input level is.
Sorry taking all info into account this simply can not be. There can be no scaling that works differently at individual frequencies. If you work backward taking into account the equivalent noise BW of the bins and the window function the answers have to agree there is no other possibility.
Anyway an averaging can little help. Now I can see difference between the two twin T notches. Previously plots was made via the notch built from the RLC polystyrenes. Now the notch built from the Wima FKP2. Without the averaging difference is not seemed:
http://content32-foto.inbox.lv/albums/e/elterra/1kHzAver/1kHzTTWima.jpg
With the averaging 10 times:
http://content32-foto.inbox.lv/albums/e/elterra/1kHzAver/1kHzTTWimaAver.jpg
Software set up (without averaging):
http://content32-foto.inbox.lv/albums/e/elterra/1kHzAver/SoftSet.jpg
The oscillator had run with the max. possible output app 2.8V RMS.
The scale is adjusted at 3kHz. I do not think that may by very big errors in the level readings at this frequency. At the 2kHz app. +4dB must be used for the properly level calculation.
Why is the noise floor dropping with averaging added? That shouldn't happen.
Sorry taking all info into account this simply can not be. There can be no scaling that works differently at individual frequencies. If you work backward taking into account the equivalent noise BW of the bins and the window function the answers have to agree there is no other possibility.
Right. So what is screwing up in the software?
Do you still have you emu and ARTA? Try it.
I didn't actually use a notch just a pot to attenuate the signal.
If you look closely the noise didn't rise 40dB with gain I added.
Last edited:
Can this be of help?
https://www.dsprelated.com/showthread/comp.dsp/276788-1.php
and
https://www.ap.com/technical-library/fft-scaling-for-noise/
???
-RNM
https://www.dsprelated.com/showthread/comp.dsp/276788-1.php
and
https://www.ap.com/technical-library/fft-scaling-for-noise/
???
-RNM
Last edited:
Your noise is possibly not coming from the input signal alone i.e. at some level the A/D quantization noise matters. A typical sound card is not very good at the 10's of nV level. That's why a notch and some low noise gain is needed, IIRC the mic pre in the EMU is not too bad at HIGH gain. This is the classic RTI/RTO noise problem with instrumentation amplifiers, or even think of a 50K pot in front of a 4nV amplifier (the RTI noise moves all over the place with attenuation).Right. So what is screwing up in the software?
Do you still have you emu and ARTA? Try it.
I didn't actually use a notch just a pot to attenuate the signal.
If you look closely the noise didn't rise 40dB with gain I added.
Last edited:
The AP note says exactly what I have been saying, please read it. I guessed 2db on the Hann window it's actually 1.7 dB. My point remains, without effort a typical oscillator is around 18 or so nV/rt-Hz or -155dB in a 1hz BW. Showing a plot where the noise is -175dB requires an equivalent BW of .01Hz or roughly 10,000,000 points at 96kHz sampling and a front end that supports that noise level AND overcomes the A/D quantization noise. BTW you can verify all this with CoolEdit's FFT and a few made up signals all done in CoolEdit, a good educational exercise. You can make up noise signals, vary FFT length, number of averages, and window function and observe the changes.Can this be of help?
https://www.dsprelated.com/showthread/comp.dsp/276788-1.php
and
https://www.ap.com/technical-library/fft-scaling-for-noise/
???
-RNM
The first discussion has the usual problem that there is only one right answer and you are left to guess which one it is. Or more importantly the one's that are unnecessarily complicated. Starting with Parcival's theorem and saying the power in the FFT and the time domain signal are the same leaves a lot of thought for the average reader.
Last edited:
Your noise is possibly not coming from the input signal alone i.e. at some level the A/D quantization noise matters. A typical sound card is not very good at the 10's of nV level. That's why a notch and some low noise gain is needed, IIRC the mic pre in the EMU is not too bad at HIGH gain. This is the classic RTI/RTO noise problem with instrumentation amplifiers, or even think of a 50K pot in front of a 4nV amplifier (the RTI noise moves all over the place with attenuation).
I have my Twin T which I haven't used since I got the the 725.
I'll convert it to a passive notch.
How low in noise does the amplifier need to be? Is an OPA134 good enough?
That's what I buffer the TT with.
A typical sound card is not very good at the 10's of nV level.
Which is why I like like using the 725 as I am. It pushed the the measurement up far above the 10's of nV where the converter has better linearity.
I think what your saying here is what Richard Moore sighted many years ago.
I don't know if he ever mentioned this here on the forum. He shared it with me in an email.
Richard Marsh has said the same. Sound Cards are not accurate below -100dB.
The notched normal mode output of your THD analyzer should work fine with a sound card if you amplify it by a known amount, say 40dB and take that into account. I did this with a Sound Technology 1700B 25yr. ago. That instrument became a poor man's AP with the addition of passive L/C filters and twin-t's. OPA-134 should be fine for this.
Which is why I like like using the 725 as I am. It pushed the the measurement up far above the 10's of nV where the converter has better linearity.
I think what your saying here is what Richard Moore sighted many years ago.
I don't know if he ever mentioned this here on the forum. He shared it with me in an email.
Richard Marsh has said the same. Sound Cards are not accurate below -100dB.
BTW, the QA is nothing but a sound card in an instrument like wrapping.
- Home
- Design & Build
- Equipment & Tools
- Low-distortion Audio-range Oscillator