I get from this conversation that the input is inverting? series 1.5K.
??
because i get slightly different numbers on noise with my generators... each 600 ohm Zo and with a short and apparently some gain changes too???
Also, the 1.5K could be reduced if the amp isnt an inverting one for lower noise.
Also, we noted that the input isnt 0dbv or 1v. In my case it is 2v. We can change the number calc on the screen but that doesnt change the noise level shown.
And another also.... the range is on 3v scale.... this not only needs the output corrected by 6db but Also, the gain is reduced by 10 on that range... showing a lower noise floor.
I am good for about -160-165db on the 725D, normally (on -100 db FS range). It is quieter than older models and many sound cards.
THx-RNMarsh
Last edited:
Also, the 1.5K could be reduced if the amp isnt an inverting one for lower noise.
But it's not, get beyond the gibberish. You are making no sense.
Actually a passive twin T has more than enough to eliminate any serious issues. Calibrating for the attenuation of the harmonics is an inconvenience but easily accomplished. Funny even that article from AP ignored potential scallop loss for the window they used. The devil is in the details.
http://dspguru.com/sites/dspguru/files/Scalloping Loss Compensation-Lyons.pdf
Thank you. Now I know, that my software which runs in Hanning mode may has scalloping error no more than 1,4dB
")
Hi Scott,
Did the scale test for the 725D.
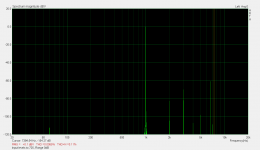
Pic #1 is the input levels to the 725D. The Range is 0dB. The test tone is about 6.7kHz at -60dBV. I placed the cursor beside the test tone.
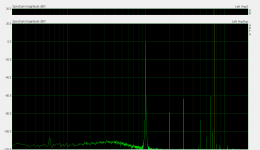
Pic #2 is same input levels measured at the monitor output. Analyzer is in level mode. Range is 0dB.
Pic #3 Monitor output levels in distortion mode. The lowest practical range I can use at these levels is -50dB. Therefore 0db on ARTA is -50dBV FS. The test frequency is -10dB down from 0dB FS, (-60dBV).
This is right where the level of the test tone should be.
I don't see any problems with the Shibasoku 725D. The scaling is correct.
Did the scale test for the 725D.
Pic #1 is the input levels to the 725D. The Range is 0dB. The test tone is about 6.7kHz at -60dBV. I placed the cursor beside the test tone.
Pic #2 is same input levels measured at the monitor output. Analyzer is in level mode. Range is 0dB.
Pic #3 Monitor output levels in distortion mode. The lowest practical range I can use at these levels is -50dB. Therefore 0db on ARTA is -50dBV FS. The test frequency is -10dB down from 0dB FS, (-60dBV).
This is right where the level of the test tone should be.
I don't see any problems with the Shibasoku 725D. The scaling is correct.
Attachments
But it's not, get beyond the gibberish. You are making no sense.
i am bring up a list of things to look into ---- for possible explanation.
no explanation is being attempted .... for david and others with such instruments so they can help also.
-RNM
Hi Scott,
Did the scale test for the 725D.
This is right where the level of the test tone should be.
I don't see any problems with the Shibasoku 725D. The scaling is correct.
This is EXACTLY what I just showed earlier. Same test with what I called an idle tone at specific level. I did it at even lower levels.
I get same results you do.
If you are on 725 distortion mode, switch to your -60dB range and you will get a FS reading.
I set up my analog spectrum analyzer and adjusted the two tones (990Hz and idle tone of 2.4KHz). I made the idle cal tone also be -60dbv. The idle tone gen is the ShibaSoku AG16B with precision attenuator. I then applied that combo of signals/levels to the AD725D and QA401.
I got exactly -60dbv on PC screen for the idle tone on the 725 -60 scale. With the atten, I then dialed in additional -10dB steps and changed the 725 lower by 10dB. Same, same. All the way down to 725 scale of -80db .... see below...


THx- RNMarsh
Last edited:
Same, same. All the way down to 725 scale of -80db .... see below...
View attachment 603140
View attachment 603141
THx- RNMarsh
Again PLEASE what are you showing here there are a bunch of numbers rattled off and I can't make any sense of it. What is the equivalent noise BW of your display and what is the rms level of 0dB. If you are saying that -80dB is really -180dB this is wrong PERIOD due to some gross misunderstanding.
geeez Scott..... you havent been following along on this subject .... 0 is always 1v or 0 dBV..
-80dBv is at the top.... shown by QA401 as 0dB. Count each division from top to bottom --- -80, -90, -100, -110, -120, 130, -140, -150 to the noise.
THx-RNMarsh
Post #6082 Your comment, if you are now saying you were wrong by 20dB sorry for wasting the time.
0 = -100dBV
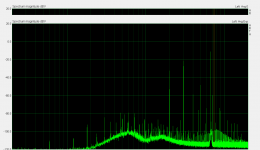
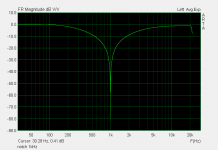
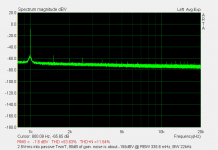
I converted my Twin T to a passive notch filter. I'm using the Shibasoku 725D in level mode to provide the gain. The following is the result of 2.5Vrms into the TT at 1kHz. ARTA 44100Hz, 131072 points, RBW 336.5mHz, BW 22kHz.
725D 400Hz and 30kHz in.. Range -90dB
Harmonic level + Correction factor
2nd -150.32dBV + 9dB = -141.32dBV
3rd not obtainable
4th not obtainable
5th -156.15dBV + 2.68dB = 153.47dBV
6th not obtainable
7th not obtainable
8th not obtainable
9th -156.94dBV + 1.42dB = -155.82dBV
10th not obtainable
Pic #1 Twin T FR.
Pic #2 spectrum
Noise normalized to 1Hz would be about -145dBV
Attachments
Last edited:
...... At -100dbv or any range it does not appear to be directly related to the noise shown on the monitor output.
With no signal on the 725 input (shorted), set to level mode only and the scale set to 1v/0dbv, the noise floor at the monitor out port ref 1v is -122db. The QA401 is considerably better, so isnt a factor on the noise shown at the monitor output. So, on this port we can have>120dB range ref to the 1 volt max output of the port.
Still with shorted input-- When set to distortion mode, the monitor noise increases significantly to -55-60dbv re 1 v max..
This is all processing/dsp et al noise, as there is still no test signal applied. It is the limit to the distortion level measurable.
However, you can show lower noise than -60 on the monitor output if there is a filter applied to that port. Such as is in common with the 400Hz Filters. The ADC/FFT is working on a signal from 0-1v.
The 725D has its Harmonics shown with the monitor output noise as scaled to the equiv of the selected scale... lowest being -100db scale.
THx-RNMarsh
Last edited:
I converted my Twin T to a passive notch filter. I'm using the Shibasoku 725D in level mode to provide the gain. The following is the result of 2.5Vrms into the TT at 1kHz. ARTA 44100Hz, 131072 points, RBW 336.5mHz, BW 22kHz.
725D 400Hz and 30kHz in.. Range -90dB
Harmonic level + Correction factor
2nd -150.32dBV + 9dB = -141.32dBV
3rd not obtainable
4th not obtainable
5th -156.15dBV + 2.68dB = 153.47dBV
6th not obtainable
7th not obtainable
8th not obtainable
9th -156.94dBV + 1.42dB = -155.82dBV
10th not obtainable
Pic #1 Twin T FR.
Pic #2 spectrum
Just what we measured before.
Check
Where is that 1.5K located?
-RNM
Last edited:
Just what we measured before.
Check
Where is that 1.5K located?
-RNM
Imaging from the Mdac in the multiplier modulated with other noise.
You can see 60Hz side bands from level modulation at the base of the fundamental.
It's a bit obscured by the noise but I had some better images of this. The fuzz is from the averaging being disturbed.
Last edited:
Just what we measured before.
Check
Where is that 1.5K located?
-RNM
My original question was relative to a claim of <-150dB on all harmonics, if -+10dB answers are OK that's important to know. Dave's plot looks very reasonable. Next issue then might be fortuitous cancellation effects, that is, the best answer is not necessarily the right answer. Several experiments have been posted with component swaps changing the harmonic structure/amplitudes. Anyone have a technique for determining the right one?
The 1.5K I was referring to was at the very input, not removable without changing things. One was the parallel combination of the resistors determining the minimum gain the other balanced that resistance. IIRC it was also several Watts and maybe for protection too?? I don't think the noise of the Shibasoku at the 3V range will affect the measurements. Making an oscillator with 5nV of noise would require all frequency determining resistors to be 100's of Ohms and the op-amp would probably limit the distortion. Dave's plot agrees with my back of the envelope estimate.
Last edited:
Could you make a correction file for ARTA (like a mike correction) to work with a passive twin T? It would remove the manual correction requirement. I have tried this in Praxis and it works. I have not looked deep enough into Arta to see if its possible.
Sure but I wouldn't know how to get it to track frequency change.
if it's just for one frequency then I think so.
How did you get it to work for all?
the monitor output Z is too high. Can you tell me which board and which IC drives that monitor port from schematics?
I am going to lower the series R. I think i can get a little better noise on the monitor output.
THx-Richard
The monitor port is buffered with a gain of 2. Then attenuated by a voltage divider by 2.
Move the the take off to before the buffer. But be aware this could cause error for the meter.
Sorry don't remember. A7 card I think.
- Home
- Design & Build
- Equipment & Tools
- Low-distortion Audio-range Oscillator