Thank you very much!* Ref angle stepping improved with '0 deg' angle step setting in Options.
* Preference rating with three decimals.
Probably you're right.* Final CTA-2034-A is clear for rear hemisphere.
Actually, I am reading CTA-2034-A R-2020 as well and I'm still baffled by the description below because I can not find the reason why they changed their expression if these two were identical.
I felt their intention from these descriptions but well, I'm not good at English, it is my excuse anyway.

• Rear Wall Bounces: 180º, ± 90º horizontal
• Rear: ± 90°, ± 100°, ± 110°, ± 120°, ± 130°, ± 140°, ± 150°, ± 160°, ± 170°, 180°
horizontal, (i.e.: the horizontal part of the rear hemisphere).
o Rear wall bounces: average of 180º, ± 90º horizontal
3. “Rear” is defined as the average of 19 measurements at 180 degrees off the
main-axis ±90 degrees (i.e.: the horizontal part of the rear hemisphere).
(P.12 5.2 Post Processing of Data / Early Reflections)
• Rear: ± 90°, ± 100°, ± 110°, ± 120°, ± 130°, ± 140°, ± 150°, ± 160°, ± 170°, 180°
horizontal, (i.e.: the horizontal part of the rear hemisphere).
(P.13 5.2 Post Processing of Data / Horizontal Reflections)
o Rear wall bounces: average of 180º, ± 90º horizontal
(P.52 Purpose of the Measured Directivity Data for Post-Processing / The early reflections)
3. “Rear” is defined as the average of 19 measurements at 180 degrees off the
main-axis ±90 degrees (i.e.: the horizontal part of the rear hemisphere).
(P.52 Purpose of the Measured Directivity Data for Post-Processing / Horizontal reflections. )
• Rear Wall Bounces: 180º, ± 90º
This in kinda tolerance marking but the problem is extra comma between values. Correct and clear/understandable format would be 180±90º.
Looong press enter key needed for suppressing over a thousand "Phase is missing"...
The latest build 2.0.76.5 (2021-09-13) uploaded a minute ago gives single error message.
Indeed, especially after they used "0º, ± 10º" format to describe 0º and ±10º in the above row.Correct and clear/understandable format would be 180±90º.
Thank you! Now I am free from a minute of long press!The latest build 2.0.76.5 (2021-09-13) uploaded a minute ago gives single error message.
Thank you! Now I am free from a minute of long press!
How do you manage to create such illegal data? Responses should be exported for example from NFS in VACS format which contains all three columns.
Another problem with missing phase is that it's suitable for single way or complete speaker only. Not for individual drivers and simulation of multi-way requiring actual/normal phase for proper summing. For example derived minimum phase does nor work so missing phase column is not usable.
How do you manage to create such illegal data?
...Another problem with missing phase is that it's suitable for single way or complete speaker only. Not for individual drivers and simulation of multi-way requiring actual/normal phase for proper summing.
I've just downloaded them from another forum.
Hence I've never built a single loudspeaker, I need to create a correlation between my subjective spatial impression and measured performance, and ascertain the right target directivity.
So, I know the problems but directivities (and scores maybe) was my only interest.
Love this software. Absolutely love it. Does it all. Thankyou.
Probably a rare use case but I noticed when trying to set up an active X.5-way, is there a way to set drivers so the fed from different amps? As when connecting to same generator they sum to +6db but with an active 2.5 way where the woofers have their own amps the acoustic sum would be +3db, no?
Also, how to rotate drivers on Y axis I.e. 3 way with side firing woofer? I know generally no need due to woofer only covering Omni-directional frequencies but still.
Member
Joined 2003
Yes, as b force mentioned, two amps of the same gain will not produce a different result of a single amplifier. If your amps have different gain, you can use the op-amp block to make the adjustments in the simulation.
For the side woofer, measure as you normally would for a driver on the front baffle, but file naming with the “on-axis” as 90 degrees, and the front facing 90 degree measurement becomes 0 degrees. Calling a bass driver completely omnidirectional is a bit of an oversimplification.
For the side woofer, measure as you normally would for a driver on the front baffle, but file naming with the “on-axis” as 90 degrees, and the front facing 90 degree measurement becomes 0 degrees. Calling a bass driver completely omnidirectional is a bit of an oversimplification.
Sorry if asking some basic questions but the thread is too long and there is never enough time: I used to design my speakers in PCD and I always took some shortcuts: basically I would place the microphone at a listening point (at a distance in front of the origin point (0,0) usually at a listening height when sitting). Then I take two channel transfer function measurements (Pa/V), so the sound is normalized with respect to voltage (both amplitude and phase). Because the changes in delivered voltage have been taken into the account I would enter impedance into the software just as a constant value across the bandwidth to be covered by the respective driver. Frd files for each driver's H1 type transfer function would be entered with both the amplitude and the phase info and then the sftw would do its calculations for added filters etc.
This time I mocked up the summed response for a pretty complicated speaker in VituixCAD. I entered driver coordinates for placement on the baffle and used manufacturer freq response and impedance curves to only check into the speaker concept. The Xover is a combo of active and passive (a lot of drivers and trying to keep it down to a three way). Well bass section was not modeled yet, just the lower and upper mid/tweet section that is pretty complicated (basically a three piece upper mid section that can be seen here):
https://www.diyaudio.com/forums/multi-way/365730-scaling-4inch-upper-mid-tweet-output-3.html#post6616292
I am cutting boxes now and I would like to take a measurement off the real box/baffle and recalculate the Xover before ordering parts for the passive portion. Would you gents please chime in and clarify what might be the right way to do it for Vituix? I would not mind staying in VCAD since it looks like a cool software and I already have the concept modeled there. I am hoping to be at the point to take measurements next weekend (before the weather turns cold for an early morning outside). Thx a lot.
Last edited:
Member
Joined 2003
So the question is “How do I measure for VituixCAD”?
The manual is here:
VituixCAD help 2.0
You will find near the start “how to start working with VituixCAD” with links to measurement guides for ARTA, REW, and Soundeasy. Start there.
The manual is here:
VituixCAD help 2.0
You will find near the start “how to start working with VituixCAD” with links to measurement guides for ARTA, REW, and Soundeasy. Start there.
Member
Joined 2003
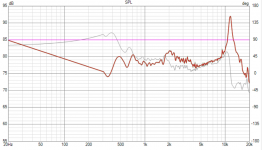
The file is essentially missing data, so Vituix is attempting to fill in the gaps by observing the slope of the response at the end of the data. It’s not doing a great job here due to the lumpy response, likely your measurement window is too long causing this.
The question is how would you like to fill in the missing data? Usually the far field response would be merged with a near field measurement, or you can merge with a cabinet model with diffraction simulation.
To use the measurement as is, you can fill in the missing data yourself using the calculator tool in VituixCAD. The "minimum phase" feature allows you to manually determine the slope of the response for the missing data, and it has a check box there to maintain the measured phase.
Last edited:
Personally I would like to see no extrapolated data at all.
Since it's very confusing (and non existing data)
Back in the day Speakerworkshop just showed frequency from were the dataset started.
Which is very clear for the reader, since it obvious shows; "there is no further data".
And/Or it is very obvious what time window someone used (well, at least the length)
Last edited:
How to switch it off?
Very simple. Follow measurement instructions i.e. measure full range, or add single frequency point at 5 Hz to the beginning of response file if response file has bad errors at LF.
For example time domain and exporting IR which requires range down to 0 Hz so some extrapolation is mandatory.
Personally I would like to see no extrapolated data at all.
Same for you. Follow measurement instructions and you will never see extrapolated data and problems it may cause.


- Home
- Design & Build
- Software Tools
- VituixCAD