- the system measurement was made 0-90 hor at the tweeter axis (thus making bass/mid at y -160 mm)
I wouldn't publish this kind of measurements because vertical plane is not included and measurement distance does not equal to final listening and simulation distances which changes phase matching and woofer's relative magnitude.
At the risk of embarrassing myself, here is some of my work from the last few days.
(look at this message and next two for whole story)
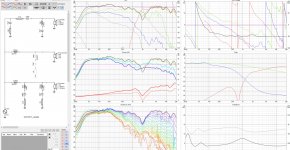
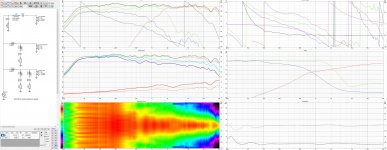
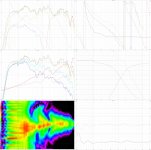
First is what I will call a "basic xo", minimal components, only on axis considered, looking for the big reverse null.
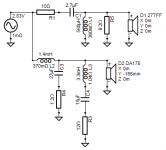
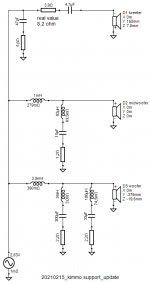
Crossover,

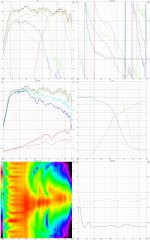
Overall,

Overall reverse polarity,

Horizontal polar response normalized,

Power response,

Vertical directivity,

Vertical polar response normalized,

Vertical polar response chart before XO, at XO frequency, after XO,


(look at this message and next two for whole story)
First is what I will call a "basic xo", minimal components, only on axis considered, looking for the big reverse null.
Crossover,
Overall,
Overall reverse polarity,
Horizontal polar response normalized,
Power response,
Vertical directivity,
Vertical polar response normalized,
Vertical polar response chart before XO, at XO frequency, after XO,
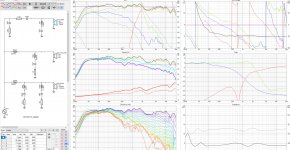
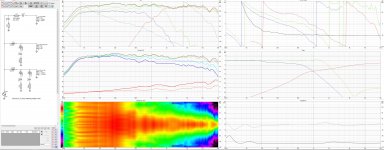
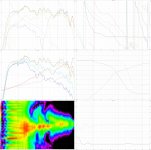
Here is the next crossover with attention to vertical directivity,
Crossover,

Overall,

Overall reverse polarity,

Horizontal polar response normalized,

Power response,

Vertical directivity,

Vertical polar response normalized,

Vertical polar response chart before XO, at XO frequency, after XO,


Crossover,
Overall,
Overall reverse polarity,
Horizontal polar response normalized,
Power response,
Vertical directivity,
Vertical polar response normalized,
Vertical polar response chart before XO, at XO frequency, after XO,
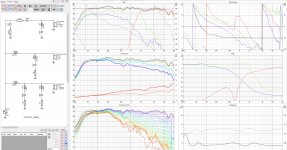
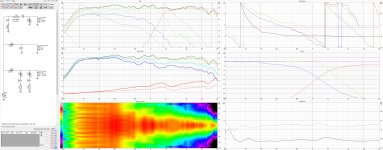
Here is the third crossover with a little shaping applied,
Crossover,

Overall,

Overall reverse polarity,

Horizontal polar response normalized,

Power response,

Vertical directivity,

Vertical polar response normalized,

Vertical polar response chart before XO, at XO frequency, after XO,


Crossover,
Overall,
Overall reverse polarity,
Horizontal polar response normalized,
Power response,
Vertical directivity,
Vertical polar response normalized,
Vertical polar response chart before XO, at XO frequency, after XO,


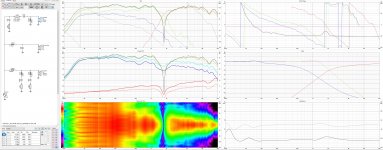
Second version looks most promising due to rational and healthy crossover connection. Curves at mid-range look reflections, listening window RMS should have tilt down above 7 kHz (assuming that mic calibration is accurate) and overall balance could tilt a bit down from high-mid to mid-treble i.e. on axis pressure a bit higher at 1-1.5 kHz.
Few more wishes. I still like to play with measurement data. Frd and zma files are okay if sending of pir files is not possible, but possible reflection at midrange should be checked.
Please attach just schematic, six-pack image and single extra directivity chart for vertical plane to forum. Reverse null and polar chart at single frequency are not very valuable.
I was just considering reverse null in my 2,5 way project. Because in my example it is barely visible, because of the midwoofer break-up RLC trap (I need to turn it off to see the reverse null). Is this something to worry about?
Attachments
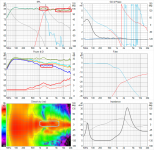
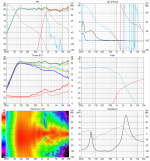
Here is one version of Dave's project. Goal is to show just three design tips with single six-pack image. I'm not saying that it's perfect and only possibility.
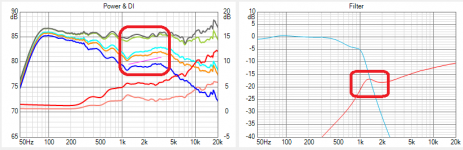
On-axis response is hidden to emphasis that it could just disturb XO design. Green trace is listening window RMS.
1) Power response is flat horizontal at XO band from 1.1 to 3.5 kHz to avoid S-curve in power i.e. higher power above XO than at XO frequency. This is done by increasing axial power at XO band. Not much other choices in this case with phase match because both cone and wave guide are directive at XO, and box is less directive ~3 kHz. In-room response and total ER have tiny shallow dip ~1 dB so balancing compromise is done with on-axis and ER.
2) Listening window RMS should not be hot at HF. Usually small tilt down is more natural and less sibilant though possibly a bit dry/dull.
3) Small phase difference around XO frequency is designed so that main axis aims to small positive angle (up). Speaker stands doesn't have to be very tall or listener can lift a bit without losing XO band due to lobing.
Attachments


") )
)Top five responses have the same trend upwards from XO to 3.5 kHz. Result depends on what you listen, but any relative emphasis around 3 kHz is almost the worst case scenario. For example 80s' Iron Maidens having hump at ~3 kHz possibly due to monitors with BBC dip cannot tolerate any systematic mistakes.
In addition, you boost LF of tweeter with impedance peak of system resonance. That is not healthy action though wave guide helps in your case. There will be excursion peak at 1.15 kHz but 0.25 mm won't be exceeded with normal SPL. Unnecessary excursion causes extra IMD.
In addition, you boost LF of tweeter with impedance peak of system resonance. That is not healthy action though wave guide helps in your case. There will be excursion peak at 1.15 kHz but 0.25 mm won't be exceeded with normal SPL. Unnecessary excursion causes extra IMD.
Attachments
I was just considering reverse null in my 2,5 way project...
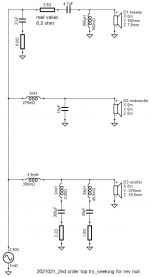
I don't understand why you have added LC notch at 700+ Hz for tweeter. That looks very strange. You can improve phase match around 1 kHz without creating too much dip to power response. And please try to avoid extra wires because they just make network image larger and more difficult to read (in addition to extra work and more difficult modifications).
DaveFred circuits have serial resistors in the tweeter circuit. In one case, the resistor first, in the other between the capacitor and the inductor. Or it can put it after the inductance before of the speaker. Is there a difference in the effect on the resulting tweeter curve?
I don't understand why you have added LC notch at 700+ Hz for tweeter. That looks very strange. You can improve phase match around 1 kHz without creating too much dip to power response. And please try to avoid extra wires because they just make network image larger and more difficult to read (in addition to extra work and more difficult modifications).
I removed the notch, improved phase match and canceled extra wires. I tried implement these 3 tips, you posted before. Thanks for your support.
Attachments
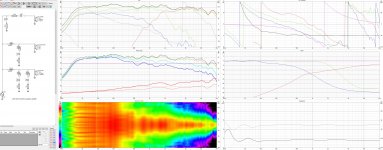
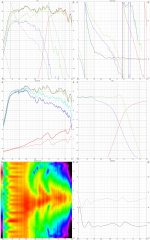
I checked simulation with Arta measurements. I needed to attenuate tweeter more than in VituixCAD simulation, the difference was 3 db, don't know why (x-over points are almost the same, as in VituixCAD sim). I also changed midwoofer break-up resonance LRC trap, because there was to much energy in 5k region (orange).
Any ways those last changes (R7 crossover) specially throwing out tweeter LC trap made some significant change to sound. It is now more precise with better stereophonic. However reverse null is still not so deep.
In R8 I want midwoofer's response to match with LR4 acoustical target curve. In the resonance region around 5k it still sticks out (used to be -12db, now is -20db). As I make trap stronger, I get phase more mismatched. Need to measure R8 RLC traps and listen a little.
Thank you.
Attachments
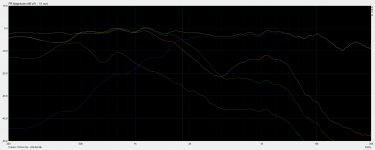
I simulated different x-over typologies and finally got deep rev null and maintained all the other aspects quite similar to R7. Does this R8 simulation in your opinion look better then R7? I didn't measure nor heard it yet.
Attachments
^Could you use six-pack export with aspect ratio of 20 dB/dec to make graphs more readable. Directivity chart with vertical polarmap. And no reverse null plots anymore because it's not quality benchmark.
Better try to read my previous messages about balancing. I don't like to judge every project separately.
Better try to read my previous messages about balancing. I don't like to judge every project separately.
Last edited:
Yes I did, and it helped.
I don't want to bother you, forgive me if I did.
Those two versions are quite close to each other that's why I was hoping to know your opinion.
I don't want to bother you, forgive me if I did.
Those two versions are quite close to each other that's why I was hoping to know your opinion.
Attachments

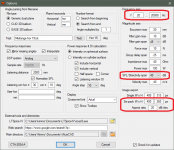
^Six-pack export is right click above any chart and then 'Export six-pack' as .png file. Default image size for single chart is 400x284 px with 20 dB/dec aspect ratio so whole image of six charts is just 806x860 px with fully readable texts. Image size is set in Options window before export command.
Span of SPL charts is best to be 40 dB.
Span of SPL charts is best to be 40 dB.
Attachments
Last edited:

- Home
- Design & Build
- Software Tools
- VituixCAD