Where can I find it?
It's nowadays Copy biquad coeffs (Ctrl+B) command in context menu. So select blocks you want to "export", right click, copy coefficients to clipboard and then paste to miniDSP app.
Generally, you all should search this kind of things from user manual before asking on forum. It's continuously updated. For example this is found by searching "biquad coefficients".
What should be the phase response in the txt file - phase or minimum phase?
Please read measurement instructions. Search "minimum phase". Result will be found if minimum phase extraction plays any role in the measurement process.
More direct answer: minimum phase extraction should not be used because it's not based on measured reality. It's just result of calculation based on some automatic or subjective assumptions by user. Already answered here quite a few times so please save me from repeating the same over and over again and read documentation.
I like this feature because it avoids the unrealistic scenario of zero DC resistance inductors and gives a closer approximation to real life than assuming zero resistance, which many circuit simulators do.DCR cannot be calculated by L and gauge alone so it's obvious that whole purpose of the feature is not to give exact result. It just tries to guess change to previous value when you change either L or gauge with up/down key or mouse wheel. Guessing is based on simple statistics from typical/available air core inductors between 0.5 and 2.0 mm.
Personally I think that feature sucks, but negative feedback is not much received. I guess most of the users realize that final DCR should be verified from datasheets of coil manufacturer.
I do a first pass using the estimated resistance values, then look up the inductors that are actually available in that value and desired physical size range and what their resistance is, insert the true resistance values of some candidate inductors back into the components to see what change this has on the response and then re-optimise the component values in a 2nd pass to achieve as close as possible to the original response. (Comparing to an overlay of my original "ideal" response)
I've only done one complete start to finish design in Vituxicad but I found this approach worked very well and I was quickly able to adapt the design to "real" inductors and get virtually identical response by tweaking other RLC values slightly. Starting with zero resistance inductors would have made the first pass much further from the final design than having an initial estimate of resistances, and having to manually choose estimate resistances during the first pass (as per Vcad version 1.x with explicit resistors for every inductor) would have been a pain.
Last edited:
in the 'power & di chart traces' settings i can not click the 'ovl' check box, so my target overlay hides the response curves.
it would be nice if the target curve thickness also could be expressed in a db range.
it would also be nice if the target curve when set could be moved around without its ends changed, like when grabbing the curve about the middle
it would be nice if the target curve thickness also could be expressed in a db range.
it would also be nice if the target curve when set could be moved around without its ends changed, like when grabbing the curve about the middle
in the 'power & di chart traces' settings i can not click the 'ovl' check box, so my target overlay hides the response curves.
ovl checkbox just informs user that it's an overlay. See user manual for scaling overlays to separate curves visually.
also, when i set curve thickness in the 'traces...' in the 'directivity' graph it changes back to default thickness when changing the 'reference angle'
Traces window for Directivity graph is mostly informative. No use to modify anything. All changes in visual style are temporary and will be lost after any change in directivity settings (such as Reference angle) because whole directivity structure including graph settings and traces is regenerated.
it would be nice if the target curve thickness also could be expressed in a db range.
Group delay, Phase, Impedance, Excursion, Velocity, Power, Force and all mystery traces with linear scale in Calculator tool know nothing about decibels so this won't happen.
it would also be nice if the target curve when set could be moved around without its ends changed, like when grabbing the curve about the middle
Rev 2.0.56.0 (2020-09-30) allows scaling of linear targets with Shift + mouse wheel or Shift+Ctrl + mouse wheel.
ovl checkbox just informs user that it's an overlay. See user manual for scaling overlays to separate curves visually.
Traces window for Directivity graph is mostly informative. No use to modify anything. All changes in visual style are temporary and will be lost after any change in directivity settings (such as Reference angle) because whole directivity structure including graph settings and traces is regenerated.
maybe i have a small screen but the graphs is at times a bit hard for me read, if curve thickness could be user set and then stay set the visability would increase, maybe in some 'global setting'? just an idea
Group delay, Phase, Impedance, Excursion, Velocity, Power, Force and all mystery traces with linear scale in Calculator tool know nothing about decibels so this won't happen.
if the frequency response target curve could be set in db range it could be used as a guide for tolerance, and the target should then be seen behind simulated responses, just an idea
Rev 2.0.56.0 (2020-09-30) allows scaling of linear targets with Shift + mouse wheel or Shift+Ctrl + mouse wheel.
cool, i must try when i get home
")
maybe i have a small screen but the graphs is at times a bit hard for me read, if curve thickness could be user set and then stay set the visability would increase, maybe in some 'global setting'? just an idea
Directivity chart as Line chart supports max. 180 visible traces. That would be quite a mess with wider than 1px traces. Some of my projects are simulated with 5 deg angle step i.e. 37 visible traces within 0-180 deg. That's also close to unreadable with 2px traces without zooming in.
Select Area, Surface or Polar map if default 1px is too thin as Line chart.
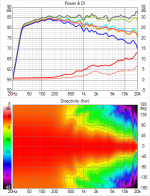
It often happens that everything looks beautiful from the charts. But it's not so beautiful by ear. For example, the middle and top played well, there was not enough bass. I set up, remade the crossover, the bass appeared, the middle disappeared. Part of the audio range gets better, but what was good gets worse. Which graphs show the balance between all parts of the audio range?
^There is no single graph (or trace) which could tell everything about sound balance we can hear. Main reason is that speaker alone cannot determine sound balance. Especially commercial speakers are probably designed assuming that room acoustics is balanced and listener is willing and capable to locate speakers and him/herself, and correct room acoustics if necessary so that designed "nominal balance" of speaker is possible realize.
Power & DI graph is intended for sound balancing - to design "nominal balance" by reference angle (~axial), listening window, early reflections, estimated in-room response, directivity index and early DI. Full measurement data and some knowledge and experience about simulated versus listened performance is needed of course.
Here is one example. All traces are close to linear with different tilt. Tilt of estimated in-room response between -0.90...-1.1 dB/oct. Not much more can be done while simulation. In addition to room acoustics and locations mentioned above, final sound depends on quality of selected drivers, mechanical construction and other components such as crossover parts. Best simulated balance does not guarantee the best audible performance and balance.
Attachments
Kimmosto,
сould you to make the graph display settings save when exiting the program? I adjust the display of the curves I need, the thickness of the lines. Then I quit the program. Then I launch it again - and I have to configure it again. These are the settings that are called by right-clicking on the graph windows.
сould you to make the graph display settings save when exiting the program? I adjust the display of the curves I need, the thickness of the lines. Then I quit the program. Then I launch it again - and I have to configure it again. These are the settings that are called by right-clicking on the graph windows.
Hello Kimmosto,
Sorry if the question have been already answered !
I've a tweeter measurement done in REW, but not fullrange, from 700 to 24 khz, in order to preserve tweeter.
How can I avoid the vituixcad phase & frequency interpolation in low end ?
The phase in vituixCad shows a phase rotation that doesn't exist in real life...
Or maybe next time I will have to filter my tweeter with a small cap in order to try a full range measurement...
++
- Home
- Design & Build
- Software Tools
- VituixCAD