Hi Ricardo,
I've found that I need to do a few things to get good FFT plots that match the error log
I'm sure there's other tricks to get similar results without the brute force method. I'd like to hear them if anyone has suggestions.
I attached the results of my edits. I takes about an hour to run on my machine (which is a workhorse). I also attached the asc file in case there's any other edits I made that I forgot to mention.
I've found that I need to do a few things to get good FFT plots that match the error log
- Plot cycles should be between 16 and 32. More cycles makes the spurs narrower.
- Long delay. I often need 2k to 3k cycles to get the noise floor to settle at -240dB. For your file, it needed a 6k cycle delay.
- Significant digits of 7. Haven't found a difference when setting to 15 or higher other than longer sim times.
- Keep the PSU bypass caps reasonably low. Higher values require very long delays. I removed the large caps that I assume were meant to represent the PSU caps. In addition, I believe these only really matter if you are trying to simulate the effects of a noisy PSU.
- I also disabled the reltol and ptrantau options you had set. Not sure if this mattered.
I'm sure there's other tricks to get similar results without the brute force method. I'd like to hear them if anyone has suggestions.
I attached the results of my edits. I takes about an hour to run on my machine (which is a workhorse). I also attached the asc file in case there's any other edits I made that I forgot to mention.
Attachments
Thank you Gentlemen
So the FFT viewed in graphical form is more accurate than the results printed in the error log.
To be able to use error log info I must increase cycle delay.
Using a large cycle delay is not good if I am trying to sim different values and compensation circuits as LT Spice takes a long time to make computations.
I made some comparisons and found that major differences are registered in 2nd harmonic while changing cycle delay.
To be able to compare 3th and 5th I settled for a cycle delay of 100.
Hope there is another way.
How can I extract data from the graph window so I can treat it in a spreadsheet ?
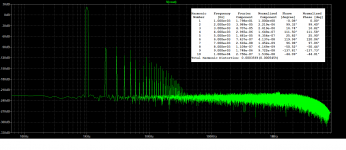
I tried a few different variations on this. These all use 16 cycles from the FOUR analysis.
With a 6 second delay, these scenarios produced the exact same results in the error log numbers:
Using the same 6 second delay, this produced very close to the same error log results, and the FFT plot was materially the same but isn't as "pretty", with the same high frequency spikes. It did run in 30 seconds though.
The real factor seems to be the delay. The value needed is a time, not just a number of cycles. Meaning siming this circuit at 20KHz would need a 120k cycle delay, meaning significantly longer runs times. And the value needed will vary depending on the circuit being sim'ed. I should also note that I removed all the power supply caps for these sims.
If the delay is too short, the THD number won't really change, but the composition of the distortion and it's phase shift will vary significantly. The trick seems to be running the sim long enough for it to stabilize and with enough resolution for it to be meaningful... assuming to believe simulated results. 🙂
With a 6 second delay, these scenarios produced the exact same results in the error log numbers:
262,144 points | significant digits 15 | Model=trap (default)
65,536 points | significant digits 7 | Model=gear
16,384 points | significant digits 7 | Model=gear
The first takes 30 to 60 minutes to run. The last 2 to 3 minutes. The FFT plot in the last scenario isn't as pretty and has some high frequency spikes.
65,536 points | significant digits 7 | Model=gear
16,384 points | significant digits 7 | Model=gear
The first takes 30 to 60 minutes to run. The last 2 to 3 minutes. The FFT plot in the last scenario isn't as pretty and has some high frequency spikes.
Using the same 6 second delay, this produced very close to the same error log results, and the FFT plot was materially the same but isn't as "pretty", with the same high frequency spikes. It did run in 30 seconds though.
4,096 points | significant digits 7 | Model=gear
The real factor seems to be the delay. The value needed is a time, not just a number of cycles. Meaning siming this circuit at 20KHz would need a 120k cycle delay, meaning significantly longer runs times. And the value needed will vary depending on the circuit being sim'ed. I should also note that I removed all the power supply caps for these sims.
If the delay is too short, the THD number won't really change, but the composition of the distortion and it's phase shift will vary significantly. The trick seems to be running the sim long enough for it to stabilize and with enough resolution for it to be meaningful... assuming to believe simulated results. 🙂
When having produced the FFT, you can "export data as text" under the "file" button.How can I extract data from the graph window so I can treat it in a spreadsheet ?
There you can select whether to export it as a polar file, dB & degrees or as Cartesian file, Re & Im.
This text file can be imported in Excel for further processing.
But it is a rather large file with all the FFT points, so restrict the FFT as much as possible.
The other way is to use your cursor to follow the peaks in the FFT.
In the lower left corner you will see what amount of dB's correspond to the position of your cursor.
Exact to within a dB, but for most situations good enough an a lot faster as waiting 60 minutes for a .four or all the steps to be taken to Excel just to find a few harmonics.
My experience is that errors with .four depend largely on the used circuit diagram.
For a Riaa preamp with fets and mosfets, where FFT's at 1kHz and 10Khz where almost the same but .four showed totally different results, I found an astonishing solution by adding a simple high ohmic voltage divider to the output and measure from there , problem almost solved !!
Installing and using LTspice IV (now including LTXVII). From beginner to advanced.
I tried this divider trick also with your .asc file but with no result, so there is no logic to find in all the different "solutions" and outcomes, so better stick to the FFT, or when comparing results from a circuit diagram where components are varied, you can use the .four for comparative purposes when FFT results are not too far off.
Hans
P.S. when instructing to running an FFT, you can enter how many points and what window to use.
Thank you Hans
I was inclined to think that way too.
The excel treatment of the four command info is easier but results are not very consistent but I found a compromise:
I am now using this setup from Kean:
"
;turn off compression and use double precision
.options plotwinsize=0
.options numdgt=8
;set frequency and timestep
.param freq 1k
.param num_fft_pts 4096
.param timestep {1/{ {freq} * {num_fft_pts}} }
;perform FFT out to 9th harmonic over last 8 cycles
.four {freq} 9 8 V(ampOut)
For the simulation command, enter the following (modify as desired):
Stop time: {20/freq}
Maximum Timestep: {timestep}
For the voltage source driving the input, enter {freq} for the frequency.
So whatever frequency you choose, the simulation will run for 20 cycles with the appropriate timestep and input frequency.
If the THD result changes depending on how long you run the simulation before the .four command is executed, that typically means there is DC drift in the circuit. See Slanted FFT below for causes and workarounds."
For a better resolution I am using (.param num_fft_pts 16384)
It is simpler than the one I was using and results of four command seem useable for my purposes.
Last edited:
Hi Ricardo.
When you look at the link in my previous posting, you will see that I was using exactly the same setup, even with a bit higher resolution FFT=2**16.
Nevertheless it gave crazy results in that specific case but not with the added divider.
If DC had be the cause, the same DC but now divided would have been there.
So DC might cause trouble but there’s definitely more that is upsetting .four
All in all it’s very annoying.
Hans
Where do i set the number of points?
How do i set it ?
I'm referring to the number of points used to determine the Maximum Timestep for transient simulations. You can it as the ".param num_fft_pts" parameter in your example.
Hi Ricardo.
When you look at the link in my previous posting, you will see that I was using exactly the same setup, even with a bit higher resolution FFT=2**16.
Nevertheless it gave crazy results in that specific case but not with the added divider.
You could try tinkering with the delay. I suspect that when a circuit has capacitors in it, the delay required to get good results with the FOUR analysis harmonics can be long. As I've stated above, it can be 3 to 6 seconds in the circuits I've tinkered with. It would be interesting to test this out with a circuit like to F5 that has no discrete caps to see if this theory holds.
Last edited:
I modified delay by setting time to start saving data to 2sec and adding also 2s to stop time and it seems to work.... now values read in the graph converted into magnitude using (10 power to dB/20) are much nearer the values read in the error log.
Will now try 6sec.....
Will now try 6sec.....
After some experiments i found that any delay larger then 100ms gives similar results. Only 0 delay shows big discrepancies. 100ms gives results very near those found with 6s.
I guess this is more a property of the circuit than of LTspice. The circuit needs some time to become stable.
It is likely that with another circuit these numbers would be different.
Jan
It is likely that with another circuit these numbers would be different.
Jan
How can I simulate the line-out connector of my DVD player in LTspice as an input voltage generator to my amplifier?
It has 2Vrms and 10 kiloohm by specs.
It has 2Vrms and 10 kiloohm by specs.
Where do I find on this quite long thread the instructions on how to convert a .cir or sbckt file into a completely working LTSpice model?
I don't get much further following the tutorials on the web.
I mean get from a .cir to a completely operative model that works like those already listed by LT. Or isn't that possible?
I don't get much further following the tutorials on the web.
I mean get from a .cir to a completely operative model that works like those already listed by LT. Or isn't that possible?
How can I simulate the line-out connector of my DVD player in LTspice as an input voltage generator to my amplifier?
It has 2Vrms and 10 kiloohm by specs.
Use a voltage source and set its output impedance to 10k
Where do I find on this quite long thread the instructions on how to convert a .cir or sbckt file into a completely working LTSpice model?
I don't get much further following the tutorials on the web.
I mean get from a .cir to a completely operative model that works like those already listed by LT. Or isn't that possible?
A .cir IS a working model. The .cir doesn't matter to LTspice, it can be .mod or .lib or whatever.
What you need is a symbol (the 'drawing' that has connection pins) that is used by LTspice to 'connect' to your .cir or whatever.
Can you post the .cir? I can then give you a step by step to use it.
Jan
After some experiments i found that any delay larger then 100ms gives similar results. Only 0 delay shows big discrepancies. 100ms gives results very near those found with 6s.
Theres also the trick of replacing large bypass caps (cant do this with other caps) with voltage sources. Run the sim to find the DC voltages across these caps and then replace them with a voltage source with same voltage. No waitong for the large caps to charge. Just remember that you wont get proper freq. response. I believe the distortion numbers will be the same, spice uses perfect caps, someone correct me if Im wrong.
A .cir IS a working model. The .cir doesn't matter to LTspice, it can be .mod or .lib or whatever.
What you need is a symbol (the 'drawing' that has connection pins) that is used by LTspice to 'connect' to your .cir or whatever.
Can you post the .cir? I can then give you a step by step to use it.
Jan
OK, try this: open your .cir and note the numbers on the .model line for the pins.
For instance, for the AD844A that section looks like the attached.
Then watch this tutorial and follow it with your own model file to create the symbol. Note: you need to open the .cir from within LTspice, selecting 'all files' to get the colored file where you can select the .model line!
Jan
Attachments

A .cir IS a working model. The .cir doesn't matter to LTspice, it can be .mod or .lib or whatever.
What you need is a symbol (the 'drawing' that has connection pins) that is used by LTspice to 'connect' to your .cir or whatever.
Can you post the .cir? I can then give you a step by step to use it.
Jan
Here's one that was posted yesterday on the Super Regulator thread:
* AD817 SPICE Macro-model Rev. A, 11/92
* ARG / ADI
*
* Copyright 1993 by Analog Devices
*
* Refer to "README.DOC" file for License Statement. Use of
* this model indicates your acceptance of the terms and pro-
* visions in the License Statement.
*
* Node assignments
* non-inverting input
* | inverting input
* | | positive supply
* | | | negative supply
* | | | | output
* | | | | |
.SUBCKT AD817 2 1 99 50 46
*
* INPUT STAGE AND POLE AT 160MHZ
*
I1 8 50 1E-3
Q1 4 1 6 QN
Q2 5 3 7 QN
CIN 1 2 1.5PF
R1 99 4 1.188K
R2 99 5 1.188K
C1 4 5 4.187E-13
R3 6 8 1.137K
R4 7 8 1.137K
IOS 1 2 12.5E-9
EOS 3 2 POLY(1) (15,98) 0.5E-3 10
*
* GAIN STAGE AND DOMINANT POLE AT 8.8KHZ
*
EREF 98 0 POLY(2) (99,0) (50,0) 0 0.5 0.5
G1 98 9 (4,5) .8415E-3
R5 9 98 5.942E6
C2 9 98 3.045E-12
D1 9 10 DX
D2 11 9 DX
V1 99 10 1.83
V2 11 50 1.83
*
* COMMON MODE STAGE WITH ZERO AT 3.16KHZ
*
ECM 14 98 POLY(2) (1,98) (2,98) 0 0.5 0.5
R7 14 15 1E6
C4 14 15 5.036E-11
R8 15 98 1
*
*POLE AT 120MHZ
*
GP2 98 31 (9,98) 1E-6
RP2 31 98 1E6
CP2 31 98 1.326E-15
*
*ZERO AT 60MHZ
*
EZ1 32 98 (31,98) 1E6
RZ1 32 33 1E6
RZ2 33 98 1
CZ1 32 33 2.65E-15
*
*ZERO AT 100MHZ
*
EZ2 34 98 (33,98) 1E6
RZ3 34 35 1E6
RZ4 35 98 1
CZ2 34 35 1.59E-15
*
*POLE AT 120MHZ
*
GP3 98 36 (35,98) 1E-6
RP3 36 98 1E6
CP3 36 98 1.326E-15
*
*POLE AT 160MHZ
*
GP10 98 40 (36,98) 1E-6
RP10 40 98 1E6
CP10 40 98 .995E-15
*
* OUTPUT STAGE
*
RO1 99 45 16
RO2 45 50 16
G7 45 99 (99,40) 62.5E-3
G8 50 45 (40,50) 62.5E-3
G9 98 60 (45,40) 62.5E-3
D7 60 61 DX
D8 62 60 DX
V7 61 98 DC 0
V8 98 62 DC 0
GSY 99 50 (99,50) 7.692E-6
FSY 99 50 POLY(2) V7 V8 5.77E-3 1 1
D9 41 45 DX
D10 45 42 DX
V5 40 41 0.04
V6 42 40 0.04
LO 45 46 .06E-9
*
* MODELS USED
*
.MODEL DX D
.MODEL QN NPN(BF=151.52)
.ENDS
- Home
- Design & Build
- Software Tools
- Installing and using LTspice IV (now including LTXVII), From beginner to advanced