How do you go about setting up the FFT settings when wanting to do a distortion test ? I am a total newbie to all of this.
Really trying to understand this and how all this would translate into testing a real design (an amp say). Until I can figure this out and make some sense of it all it seems all the results are wide open to interpretation and the actual settings used.
So the starting point is the circuit shown, which is about the simplest possible. An AC voltage source with two series connected 1k resistors across it. The junction of the resistors is Vout.
The settings I have used are shown. The transient analysis is set to run for 10ms. The frequency is 1Khz over 10 cycles.
The FFT result is shown.
I then alter the run time to 100ms and the number of cycles to 100. I set the FFT run to "look at" 0 to 10ms (the same period as in the first run).
The FFT result is now totally different. Why ?
Also what are the peaks beginining at 100Khz. When expanded the first is a double peak of approx 101.4 Khz and 103.4Khz. What causes these ?
The second run with the 100ms run time has a "first" harmonic peak at 3Khz.
Also why is the baseline (noisefloor ??) different ?
Attachments

Mooly,
Try setting a minimum time step - it should be at least 1/100 of a cycle. Granted, it takes longer, but the results are closer to what you expect.
Bill
Try setting a minimum time step - it should be at least 1/100 of a cycle. Granted, it takes longer, but the results are closer to what you expect.
Bill
On second thought, use the smallest time step you have the patience for. I just re-ran your test with a 10nS step, and it's very clean.
You do need to make sure that you use exactly an integral number of cycles. And you need to keep reducing the minimum timestep until the results stop changing.
I always used the LAST ten (or whatever) cycles of a run, and increased the run time until the results stopped changing (so that the transient response was over and it was fully into steady-state-only behavior).
It will help if you use a variable ("param" statement) to set the frequency and then form expressions to set the number of cycles and run time (or something like that; don't have my spice setup at hand, and it's been quite a while since I've played with this stuff).
As a side note, when using a real spectrum analyser to analyze harmonic distortion, one is confronted with the problem of the mixer that is just after the input attenuator. Mixers, by their nature, produce harmonics. So how would one know if they were measuring harmonics from the input or from both the input and the mixer? The answer, there, is to increase the attenuation of the input signal (either internally or externally) until the results stop changing, because mixers won't produce harmonics if their input levels are low-enough. This applies even for modern spectrum analyzers, which implement everything in digital or software form. This might occasionally apply even in simulations, depending on what is being simulated.
Last edited:
small t_max_step in .TRAN - small enough to give >2x # points vs fft length - 256k is my typical Ltspice FFT setting
the t_max_step should give a "sample rate" at least several times the slowest device ft just for minimal realistic stability/step response
integer # of cyclces of the fundamental in the analysis - I usually use integer kHz frequencies, multiples of 1 ms analysis times
use a window - select in the FFT pop up box - Blackman gives very low skirts, requires 4x longer record to resolve between peaks
bill_a and gootee,
thanks for the directions... it's starting to make a bit more sense now. I tried your 10ns suggestion and can see how much cleaner it is. Hadn't really appreciated the significance of that.
jcx,
up to now I hadn't explored the different windows. tbh I haven't even heard of most of those options before. I'd seen "Blackman" mentioned (must have been on some thread) but I didn't know what it referred too.
Can see the logic in keeping the numbers simple and in easy multiples.
Thanks folks...
I have another question too 🙂 which I'll post as a new thread if I don't find an answer.
Lots of good information here, thanks mainly to keantoken: Common Issues Encountered By New Users - diyAudio
Also see Bob Cordell's book, he goes into some detail on this same subject.
Also see Bob Cordell's book, he goes into some detail on this same subject.
Thanks mightydub. It's actually Bobs book that got me started on all this in the first place. I'll have a read at the Wiki.
I don't know if you've seen these yet.
LTspice getting started guide from Linear.com
http://ltspice.linear.com/software/LTspiceGettingStartedGuide.pdf
Yahoo groups LTspice.
LTspice : LTspice/SwitcherCAD III
LTspice getting started guide from Linear.com
http://ltspice.linear.com/software/LTspiceGettingStartedGuide.pdf
Yahoo groups LTspice.
LTspice : LTspice/SwitcherCAD III
Last edited:
I don't know if you've seen these yet.
LTspice getting started guide from Linear.com
http://ltspice.linear.com/software/LTspiceGettingStartedGuide.pdf
Yahoo groups LTspice.
LTspice : LTspice/SwitcherCAD III
The user group looks well worth a look, thanks. Downloaded the pdf too.
Mooly, your going to have to change your signature.😀
Lol, don't I just know it 😛
Mooly, here is a zip file with the simulation I use by default for all my amps. It gets very consistent results and a low noise floor.
http://www.diyaudio.com/forums/software-tools/101810-spice-simulation-23.html#post2932189
For FFT, make sure to use Blackman or Hann windowing, as rectangular window (default) gives a bloated noise floor. Here's some stuff that was recently posted on the topic:
http://www.diyaudio.com/forums/software-tools/101810-spice-simulation-23.html#post2932194
Thanks keantoken, I've downloaded your file so will have a study and a play.
I know I've a lot to learn, and there's a lot to read too.
Thanks
I know I've a lot to learn, and there's a lot to read too.
Thanks
Mooly, here is a zip file with the simulation I use by default for all my amps. It gets very consistent results and a low noise floor.
http://www.diyaudio.com/forums/software-tools/101810-spice-simulation-23.html#post2932189
For FFT, make sure to use Blackman or Hann windowing, as rectangular window (default) gives a bloated noise floor. Here's some stuff that was recently posted on the topic:
http://www.diyaudio.com/forums/software-tools/101810-spice-simulation-23.html#post2932194
I always thought that with a simulator you can use a rectangular or even no window because you can always run the FFT on an exact integer number of signal cycles.
Generally, windows are needed to avoid aliasing when the analysed signal section doesn't nicely start/stop at integer cycles. But, using a window does make the result less accurate.
So, when you use a window in LTspice, does it decrease the accuracy?
jan
I have not experienced a significant change in relative db values unless the noise floor is too high in rectangular window (and this is often for rectangular window). It is not the noise floor itself that is the problem, it is the noise floor tilt. This occurs when the window edges (try "preview window" in the FFT diologue) are non-zero and so a very long signal covers many successive windowed samples, without being fairly attenuated. This signal overwhelms the others and presents itself as a massive "tilt" in the noise floor. This is not the same as the very high noise floor that results when a low number of samples is used and the signal frequency is fractional to the samplerate.
Baudline makes this very clear, the effects of windowing become very obvious when using spectrograms because they largely affect the range and depth of the visual information. The accuracy depends largely on the specific window used. I found in spectrograms I preferred Hann. With spectrograms you can see that the thinner (widthwise) a window, the wider and less distinct the signals are. Hann and blackman I found were the competitors for audio, because of the conservative shapes and zero'd edges. I prefer Hann because the frequency resolution is better, and it seems to generate less artefacts. It is symmetrical, vertically and horizontally, so it seems to me it would be more impartial, and lends itself to using window size and number of samples to manipulate the resolution instead. Maybe I should post some Baudline screenshots as an example?
Synchronizing the frequency and the samplerate like in my simulator directives (and like you and most people suggest) provides the ultimate economy between the necessary number of cycles and samples to get usable data. There are however times when using an irrational fractional signal-to sample ratio is helpful; but I have never needed to study this and it makes it much more difficult to get a detailed simulation in a short amount of time.
Last edited:
I am double-posting because I made some big edits to my last post, and most people miss them anyways. I just compared Blackman to Hann, and the difference is that Hann has better frequency resolution, but Blackman has a lower noise floor, owing to it's thinner shape and the edges staying near zero for a larger section of the window. I still prefer Hann, but Blackman does very well to cut through the noise floor.
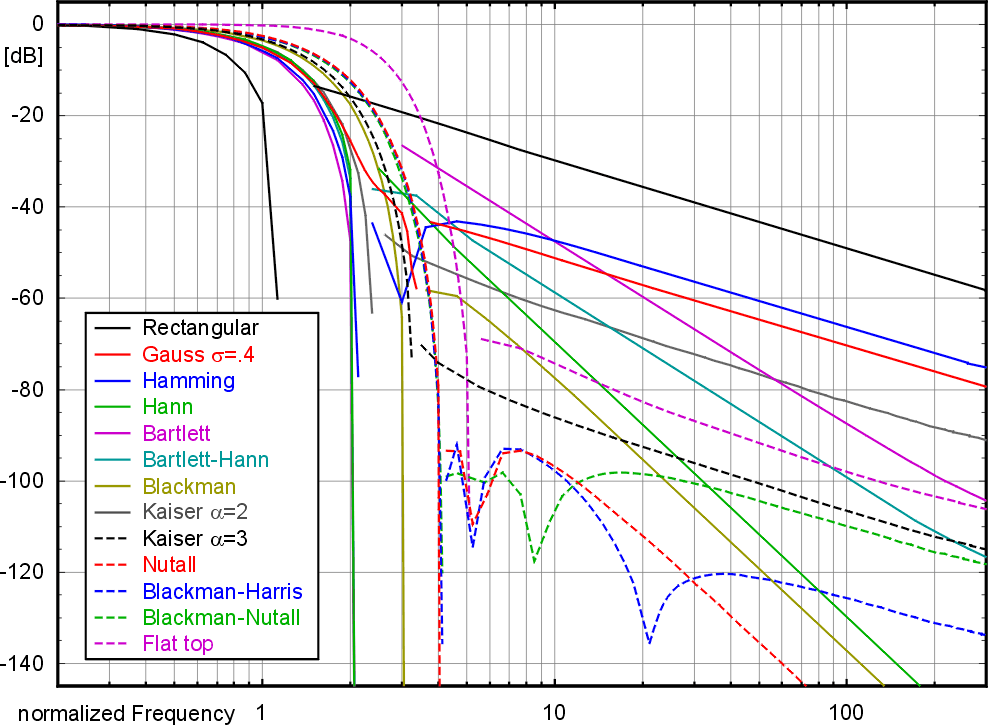
This file makes a sensible comparison of noise floor antics. You can see that some windows curve downward but then jump up and slowly descend to the right side of the graph. The ones that go straight down to the bottom are the ones that are meaningful for audio. Surprise surprise, Hann and Blackman are the most suitable. Whoah, Rectangular (LTSpice default "no windowing") is the WORST.
From Wikipedia:
https://en.wikipedia.org/wiki/Window_function
I am seeing a difference of about .015db between rectangular and Hann windows in LTSpice with a low noise floor for each. This difference is between the 200th harmonic is of a 20KHz sine wave, though if the noise floor weren't as low the low-level harmonics would be distorted by the rectangular window. The difference increases with frequency, but this may be a noise floor effect.
Last edited:
From Wikipedia:
https://en.wikipedia.org/wiki/Window_function#Windowing
So in terms of accuracy, the rectangular window would probably be the worst offender for audio work.
https://en.wikipedia.org/wiki/Window_function#Windowing
The rectangular window has excellent resolution characteristics for signals of comparable strength, but it is a poor choice for signals of disparate amplitudes. This characteristic is sometimes described as low-dynamic-range.
...
In between the extremes are moderate windows, such as Hamming and Hann. They are commonly used in narrowband applications, such as the spectrum of a telephone channel. In summary, spectral analysis involves a tradeoff between resolving comparable strength signals with similar frequencies and resolving disparate strength signals with dissimilar frequencies. That tradeoff occurs when the window function is chosen.
So in terms of accuracy, the rectangular window would probably be the worst offender for audio work.
I'm not really understanding a lot of this tbh.
If I post a Spice file (I'll leave it 'till tomorrow) could we work through a couple of really simple (I hope) FFT runs on it. It's some of the basics that I am stuck on such as,
1. I do a sim analysis that runs for 8ms at 1khz and get really good THD figures from the error log.
2. I increase the run time by a factor of 10, increase the number of cycles by 10 and alter the timestep accordingly and the figures are worse by a factor of hundreds... why ?
It's these basics I don't get, so if I could put the numbers in and the method I am using, then if anyone could see and advise where I am going wrong then that would be great.
Are you using the .four command? It uses the rectangular window by default so will give falsely awful results on circuits with enough DC drift. Always sanity-check it with the FFT.
The FFT window is not really very important as long as you stick to a good one. Not much point in tweaking FFT windows for audio. Choose Hann or Blackman and leave it at that (though you will have to choose again after restarting LTSpice). Point is that the default window totally sucks for audio, it should be changed.
EDIT: I had a circuit that had great bass behavior, until I actually built it and discovered it motorboated at 1Hz, hitting the rails. It turns out this LF oscillation was causing me a lot of noise floor trouble. A while back I helped OS to find and eliminate sources of drift in simulation. In retrospect I wish I had known I could just use the Hann window. It is still useful though to get the .four command to give useful output. It may be hard to address your issues if we do not see the schematic.
DC drift shows up more in the FFT the longer time period is simulated. It can be a big problem when using the .four command at 100Hz and below.
Last edited:
- Status
- Not open for further replies.
- Home
- Design & Build
- Software Tools
- LTSpice FFT simulation settings and inconsistent results.