Nyquist theorem says so, and my S/H shows it. At fs/2 that is 22.05k for 44.1k SR it should not be able to sample or modulate and notch out that frequency.
Nyquist theorem says so, and my S/H shows it. At fs/2 that is 22.05k for 44.1k SR it should not be able to sample or modulate and notch out that frequency.
At fs/2, the signal and its first image are at the exact same frequency. Depending on the phase relation between the signal and the sample clock, they may cancel each other or not.
You can see that in the time domain. The attached figure shows a sine wave with unit frequency, so when you sample it twice per unit time, it is at the Nyquist frequency.
When you take those samples at t = 0, 0.5, 1, 1.5, 2..., all samples are zero.
When you take those samples at t = 0.25, 0.75, 1.25, 1.75..., the samples are +1, -1, +1, -1...
If you happen to sample it at points where you don't get zero results, I don't see why it would be notched out anywhere else in the chain unless it is in the stop band of a reconstruction filter.
Attachments
At Nyquist, the clock is synchronous with the signal and samples twice, but at what phase? If the clock samples at the peaks so you get sampled the alternate maxima, with no any attenuation, hence 0db and not -4db on the sinc curve. If it is sampling at zero crossing you will notch out totally to zero. If you increase the frequency gradually from 20khz towards the 22khz, you can see that it gradually decreases, by this you can assume that the singular Nyquist is a notch.
What is lacking to the transfer function is the AM modulation function to be multiplied with. It is the AM function will be the one showing the existence of the image and what will be the magnitude/phase of the two sidebands, that of the resulting input frequency and the image.
This why I took back my pilgrims baton and started making up myself the formula that I need.
Last edited:

If you have -9 dB at 21.5 kHz while fs = 44.1 kHz, it's not a zeroth-order hold. A zeroth order hold would be at -3.709663597 dB, linear interpolation at -7.419327194 dB, I don't know about cubic splines.
The Nyquist frequency is a bit of a special case because the first image is exactly at the same frequency as the original signal. Both are attenuated to 2/pi times their original amplitude when you pass them through a zeroth order hold. When they add exactly in phase, you get 4/pi times the original amplitude, when they add in antiphase 0 times the original amplitude and anything in between is also possible.
That 4/pi is precisely what you get when you have the samples +1, -1, +1, -1 and so on, pass them though a hold function that changes it into a square wave switching between +1 and -1 and then look at the Fourier series. The peak value of the fundamental of a square wave switching between +1 and -1 is 4/pi.
Use a frequency 1 Hz away from Nyquist and you have none of these complications - as long as your frequency resolution is good enough to distinguish signals 1 Hz above and below Nyquist.
Without any filtering at all, impulse sampling leads to an infinite series of equally strong images. It is rather similar to mixing/AM modulation, except that the time-variant gain of the "mixer" consists of an infinite series of Dirac impulses rather than a sine wave.
View attachment 915761
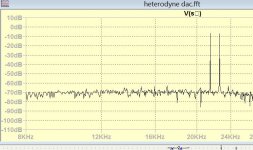
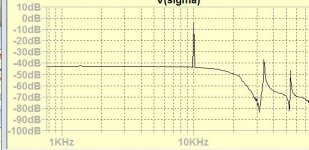
This is at 21.5khz, -9db.
What you see in your image is the 21.5Khz and its mirror at 22.6Khz and these two two peaks repeated again around 3/2fs, 5/2fs etc, with the whole spectrum multiplied by sin(x)/x.
The fact that you don’t see the -3.7dB attenuation that Marcel mentions, has to do with either the resolution of your image, with scalloping loss and/or with the use of a window.
Hans
Is the number of cycles in the DFT time integer and which of your systems does this apply to? Zeroth-order hold, cubic spline, something else? (I guess zeroth order hold as you write about an S/H.) Is the 0 dB level on the y-scale the level without sampling or holding?
Last edited:
much higher resolution. This is measured on the S/H without any treatment.
I was referring to spectral resolution.
What is the length of the time window that was transformed to the frequency domain?
Hans
This is a linear modulator that has the same character as the sampler. The modulation equation of this circuit can be found by trigonometry to be
(cosW₀/2)×(cos(W₀/2-Wm)) W₀ and Wm are the sample rate and modulator in radians. This equation can be split into two parts describing the two side bands which are the sampled signal and the image. They are then multiplied by sinc function because of step character. This should be the Nyquist-Shannon equation.
(cosW₀/2)×(cos(W₀/2-Wm)) W₀ and Wm are the sample rate and modulator in radians. This equation can be split into two parts describing the two side bands which are the sampled signal and the image. They are then multiplied by sinc function because of step character. This should be the Nyquist-Shannon equation.
Attachments

Last edited:
I am subtracting the signals at the input of the sigma integrator. Here the normal signal arrives in delta mode, derivative, which has the image 12db/octave increase in frequency. So by using the radio signals also the deltas, I need only an RC high pass of 22khz filter before subtraction.
For now I obtain at 10khz about -40db and at 17khz -30db. For 20khz it needs further elaboration.
For now I obtain at 10khz about -40db and at 17khz -30db. For 20khz it needs further elaboration.
Attachments

This is a linear modulator that has the same character as the sampler. The modulation equation of this circuit can be found by trigonometry to be
(cosW₀/2)×(cos(W₀/2-Wm)) W₀ and Wm are the sample rate and modulator in radians. This equation can be split into two parts describing the two side bands which are the sampled signal and the image. They are then multiplied by sinc function because of step character. This should be the Nyquist-Shannon equation.
See section II of Claude E. Shannon, "Communication in the presence of noise", Proceedings of the IRE, January 1949, http://userweb.eng.gla.ac.uk/charles.ironside/comms4/ShannonClassic.pdf , for Shannon's take on it.
There is a clear similarity between impulse sampling and multiplying with a sinusoidal LO, but there are also differences: an infinite series of Dirac impulses spaced T apart has spectral peaks at all integer multiples of 1/T, so you get an infinite number of images, and as 0 is also an integer multiple of 1/T, the original signal without any frequency shifts ("baseband signal") is also there.
If you would multiply the signal by 1 + 2 cos(2 pi t/T) with T the sample period, you would have modelled the original signal and the first images, the ones below and above 1 times the sample rate. You then also see that the Nyquist frequency is the frequency where the spectra of the baseband signal and the images start to overlap.
For now this is the block diagram of the signal treatment.

I harvest from Hartley the image signals as well as it's imaginary component. I add them to rephase +45° and pass through high pass of 22khz. I have automatic cancelation from 10k to 17khz. Now DC to 17khz is in the pocket.
For above frequencies, the RC filter is certainly wrong, I have the intuition it should be of higher order band pass that degenerates into first order at 17khz.
If I had the real transfer function I could deduce the perfect filter, but for now I am in "rafistolage".
Thank you Marcel for the Shannon reference.
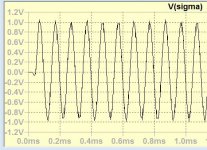
When I adjust for 20khz best -32db image, I am able to go high up to 22khz with my SSB technic. Here is the 21khz which can be cleaned by quadrant phase shifter.

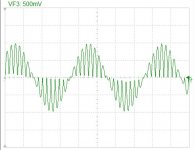
This is the 22khz just 50Hz bellow Nyquist hence slow by ssb modulation.


I will rethink about the phase shifter, highly possible to extend it 21.5khz.
This is the 22khz just 50Hz bellow Nyquist hence slow by ssb modulation.
I will rethink about the phase shifter, highly possible to extend it 21.5khz.
FFT is set to 20ms with min step 100ns
Maybe you found out yourself in the meantime, but I suspect you offered a 1Volt peak 21.5Khz signal to your S&H.
The effective value is at -3dB, so when performing a FFT, you would get a peak at -3dB before multiplication with the sinc.
Since 21.5Khz is almost fs/2, where the sinc function is 2/Pi, the spectral peak at 21.5Khz is reduced with another 3.9dB resulting in -6,9dB.
This is exactly what I get when sampling 21.5k@1V peak at 44.1K S&H in LTSpice with a 20msec window.
Hans
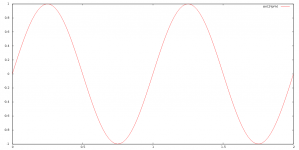
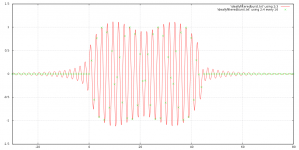
Attached are the sample values of a 1 ms long, 20 kHz sine burst sampled with 44.1 kHz (green) and the output of an ideal reconstruction filter (red). As you can see, they are equal at the sample points, but the reconstructed signal has pre- and post-ringing.
The reason for this is that the original tone burst has frequency components above Nyquist; it would not if it were a steady sine wave from t = -infinity to +infinity, but it isn't, it's a burst. The red waveform is the only signal having no frequency components above Nyquist that matches at the sample points.
Hence, if you want to get a signal that equals the samples at the sample points and that has no long pre- and post-ringing, you have to accept that you get some imaging. If you neither want to accept imaging nor long pre- and post-ringing, you have to accept that the reconstructed waveform does not equal the samples at the sample points. This holds no matter whether it is a digital, analogue or mixed-signal filter with or without mixers.
Attachments
Last edited:
- Home
- Source & Line
- Digital Line Level
- Analog Delta-Sigma interpolation DAC