Goodday to all!
Anyone knows where I can find FRD and ZMA file for seas drivers MCA15 RCY (h1262)
and seas U22REX/P-SL (h1659-08)?
Thanks in advance
Mike
Anyone knows where I can find FRD and ZMA file for seas drivers MCA15 RCY (h1262)
and seas U22REX/P-SL (h1659-08)?
Thanks in advance
Mike
Ideal vs. Real - Tip Expanded
Just a quick tip to getting the slope you want in XSim. Here's how I do it.
First, I create my schema, with the actual driver (S1) and an ideal driver (S2). S1 has the FR and ZMA files imported. I then use the Circuit Blocks to select the preferred filter alignment and cut off frequency. For illustration I chose 3kHz and 0.7 Q
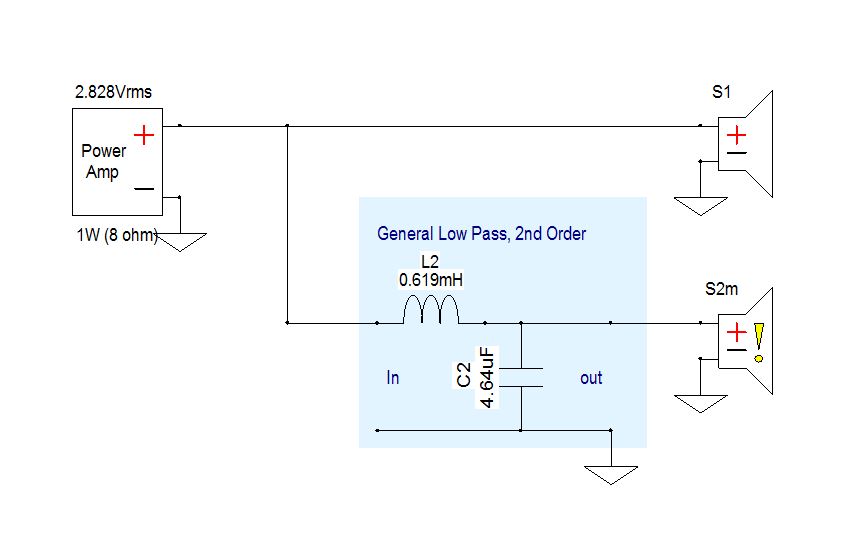
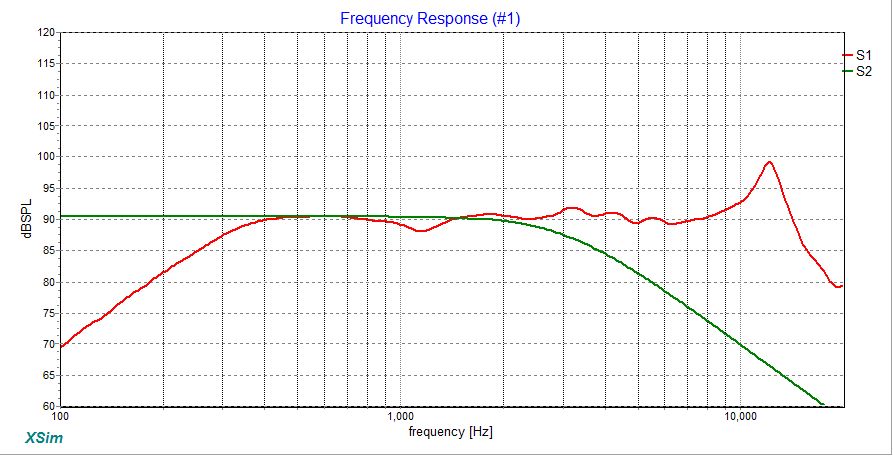
In the FR chart, I then select S1 and S2 (but not System). I adjust the "mod sensitivity" of S2 to match S1. Now you can use the green line as a reference point, while you go happily mucking about with crossover components on S1. This technique is especially useful when you must use a notch filter in addition to slope.
Hope someone finds this useful.
Best,
Erik
Just a quick tip to getting the slope you want in XSim. Here's how I do it.
First, I create my schema, with the actual driver (S1) and an ideal driver (S2). S1 has the FR and ZMA files imported. I then use the Circuit Blocks to select the preferred filter alignment and cut off frequency. For illustration I chose 3kHz and 0.7 Q
In the FR chart, I then select S1 and S2 (but not System). I adjust the "mod sensitivity" of S2 to match S1. Now you can use the green line as a reference point, while you go happily mucking about with crossover components on S1. This technique is especially useful when you must use a notch filter in addition to slope.
Hope someone finds this useful.
Best,
Erik
Attachments

Last edited:
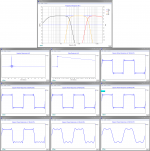
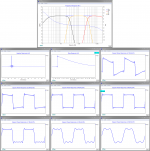
eriksquires thanks high value tips, regarding creation of target curves they can also be created in Rephase as seen in picture-3 where 3x bandpass targets is imported to 3x ideal drivers in XSim.
Create target slopes:
1. Midrange bandpass is created in Rephase as seen in picture-1, use some higher value "Taps" and "Samplerate" to get less interpolation of phase and frq response and generate a 32bit IR.wav file.
(Into Rephase should one look for Bessel second order use LR2 combined a PEQ at XO point frq with Q=0,58 +1,3dB which is created in the the tab named "Paragraphic Gain EQ")
2. Import IR.wav file in REW and offset SPL level to around a realistic 90dB area and zero align IR with button "Estimate IR Delay" before export "Measurement as text" and remember add extension dot-frd, picture-2 is slopes seen into REW.
3. Link that frd-file to a ideal driver in XSim and fine tune SPL with "mod sensitivity". In picture-3 3x passband from Rephase is linked ideal drivers woofer is BW2 20Hz - LR4 300Hz, mid is LR4 300Hz - LR4 3kHz and tweeter is LR4 3kHz - BW2 22kHz.
Also in past learned from bwaslo over Trynergy thread that if we want to see square wave response from a speaker system and don't wan't to run a live sweep and the noice it makes, then export system response from a measurement program as frd-file. Link that frd-file to one ideal driver and in "Addgraph" "More" "Square Wave Response" window sweep frq up and down to see systems waveshape.
Attachments


Last edited:
Very cool way too. Especially if you are doing more complicated stuff. We should have a contest to see who can do it faster. 🙂
Erik
Erik
eriksquires thanks high value tips, regarding creation of target curves they can also be created in Rephase as seen in picture-3 where 3x bandpass targets is imported to 3x ideal drivers in XSim.
Create target slopes:
1. Midrange bandpass is created in Rephase as seen in picture-1, use some higher value "Taps" and "Samplerate" to get less interpolation of phase and frq response and generate a 32bit IR.wav file.
(Into Rephase should one look for Bessel second order use LR2 combined a PEQ at XO point frq with Q=0,58 +1,3dB which is created in the the tab named "Paragraphic Gain EQ")
2. Import IR.wav file in REW and offset SPL level to around a realistic 90dB area and zero align IR with button "Estimate IR Delay" before export "Measurement as text" and remember add extension dot-frd, picture-2 is slopes seen into REW.
3. Link that frd-file to a ideal driver in XSim and fine tune SPL with "mod sensitivity". In picture-3 3x passband from Rephase is linked ideal drivers woofer is BW2 20Hz - LR4 300Hz, mid is LR4 300Hz - LR4 3kHz and tweeter is LR4 3kHz - BW2 22kHz.
Also in past learned from bwaslo over Trynergy thread that if we want to see square wave response from a speaker system and don't wan't to run a live sweep and the noice it makes, then export system response from a measurement program as frd-file. Link that frd-file to one ideal driver and in "Addgraph" "More" "Square Wave Response" window sweep frq up and down to see systems waveshape.
Very cool way too. Especially if you are doing more complicated stuff. We should have a contest to see who can do it faster. 🙂
Erik
Speedtest you best 🙂
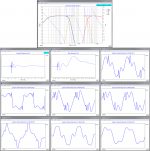
Rephase can do complicated ones.
Common for all three below they have system stop bands at BW2 20Hz - BW2 22kHz and XO is LR8.
1. All filters are IRR.
2. Stopbands are IRR and XO's are FIR.
3. All filters are FIR.
Attachments
Last edited:
I have a feature request for XSim. As a teaching tool, it would be really nice to either add a probe speaker, or add a speaker driver of very high impedance. Say 1 MOhm. The idea is that it would be nice to draw a speaker model using inductors, resistors or even capacitors and get an FR plot across them all. So for instance, if I simulate a speaker using Re and Le it would be nice to show how these parameters affect the FR and the rest of the crossover.
I could probably do this with a spreadsheet and making up my own ZMA file, but I just wanted to ask for this as a real feature.
Thanks,
Erik
I could probably do this with a spreadsheet and making up my own ZMA file, but I just wanted to ask for this as a real feature.
Thanks,
Erik
I read through the thread this evening to see whether XSim would be helpful for me using digital active crossovers. Looks like it could help with showing an overall frequency response across multiple drivers using different center frequencies and slopes for the crossovers.
But I'm really posting this to say that I do .Net (C#) development for a living. I mostly do back end business services and DB work but I know my way around WPF fairly well. If any of you guys are trying to do something in WPF and could use some help feel free to PM me and I'll be happy to do what I can.
-Chris
This week I've been messing around with XSim for the first time. I really like it! It's a pity to read that the development has stalled.
Is there any tutorial on how to use XSim ? How to import curves, set the acoustic centers etc.
I am curently truying out software and spreadsheets (other than Jeffs) and i might give XSim a try.
I am curently truying out software and spreadsheets (other than Jeffs) and i might give XSim a try.
I wrote up a description of testing driver distances with XSim here.
The driver data is imported via the Tune menu. Right click on a driver on the schematic, select "tune" and you'll see file entries to set the location of the FR and impedance data files. Tip: If the .frd and .zma files have the same name XSim will import both when you pick the FRD file. For instance: Peerless_830991.frd and Peerless_830991.zma
Best,
Erik
I downloaded XSim but i guess i'll have some spare time, for playing, this weekend so i'll see how it works.
Thanks Erik.
Thanks Erik.
Last edited:
It is worth the effort. I'm not sure if this software is being actively supported/developed. Bill may have abandoned that... But As-Is, it has taught me more about crossover design (real-world interactive stuff that my ears confirm) than anything else I have experimented with.
I know Jeff's PCD is a venerable tool, but I'm running Linux and PCD doesn't play nicely there. XSim runs happily under WINE without any heroic efforts. Or any efforts at all really 🙂
To Bill Waslo: I really hope your retirement plans are making your world a better place. If you decide to pursue development of XSim with the user input you have received, I hope that is a rewarding effort in some way. If you decide not, then Thank You for the excellent tools you have crafted for us to explore.
Cheers
Thanks, Rational35
I may do more on XSim at some point, but projects are stacking up. Don't know how I ever had time to have a job! The original plan to have XSim be (indirectly) commercial doesn't seem to be a good one, as there haven't been enough people adopting it for there to be a decent argument that any companies should support it. There aren't really all that many diyers who are wanting to do actual crossover design and what it entails. So from here, it would only be for hobby value.
I may do more on XSim at some point, but projects are stacking up. Don't know how I ever had time to have a job! The original plan to have XSim be (indirectly) commercial doesn't seem to be a good one, as there haven't been enough people adopting it for there to be a decent argument that any companies should support it. There aren't really all that many diyers who are wanting to do actual crossover design and what it entails. So from here, it would only be for hobby value.
I have a feature request for XSim. As a teaching tool, it would be really nice to either add a probe speaker, or add a speaker driver of very high impedance. Say 1 MOhm. The idea is that it would be nice to draw a speaker model using inductors, resistors or even capacitors and get an FR plot across them all. So for instance, if I simulate a speaker using Re and Le it would be nice to show how these parameters affect the FR and the rest of the crossover.
Erik, all you need is a way to read a voltage across two points. Take your crossover circuit and plop a new resistor onto the schematic. Tune it's value to 1MEG ohm (type in "1" and six "0"s). Then connect it to the two circuit nodes you want to see the voltages between. Then, "Add Graph", "more", "Component Voltage (V)". In the new graph, do "Curves" and select your shiny new megohm resistor. Presto, a voltage probe! (You can make current probes, too, but most loops you'd want to read already probably pass through a single component you can just plot current for).
edit: Note also that you can add as many of these probes as you want and monitor them all simultaneous in separate curves on the voltage graph (or even individual graphs if you wanted).
Last edited:
what program is better for trace the spl and impedance curve?
because with spltools (spltrace) the graph in xsim result like this:
I want to plot this yellow graph:
because with spltools (spltrace) the graph in xsim result like this:
An externally hosted image should be here but it was not working when we last tested it.
I want to plot this yellow graph:
An externally hosted image should be here but it was not working when we last tested it.
zedda,
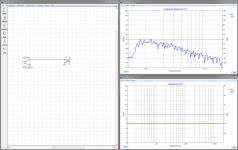
Traced your yellow graph with FPGraphTracer, result shown below into XSim is with smoothing set to none, and find that frd file attached in zip folder below.
Link to free program FPGraphTracer : fprawn labs.
To also get minimum phase extracted that belong the frq response, there is tools over at Charlie Laub and Jeff Bagby site here software.
Attachments
what program is better for trace the spl and impedance curve?
because with spltools (spltrace) the graph in xsim result like this:
After you load the picture to SPL Trace, go to Alignment and register
the frequencies, amplitude and make sure that it's done correctly.
Then go to Trace Options, select Trace limits and define the values.
Greater number of trace points makes it look more precise and takes
longer to do the job. Select Start SPL Trace and pay attention to where
the horizontal line intersects with curve of your interest. When you think
you got that, click once and it will move to the right. Proceed till it says that
you have reached the limit, then save it.
- Home
- Design & Build
- Software Tools
- XSim free crossover designer