Here is my first try on "taming" the driver🙂
On a baffle most of that won't be necessary.
LOL thanks, yes especially when I have no idea on what most of it means in Danish, I am sort of adding the English electronic language to my own language as if they were Danish word, with no way to translate it. 🙂Good luck, I imagine learning English using technical material is about the hardest way to do it.
Okay so I shall try to learn to add a baffle first, then add drivers?On a baffle most of that won't be necessary.
Okay so I shall try to learn to add a baffle first, then add drivers?
Yes, you might need this.
HiFi Loudspeaker Design
Thanks a lot, look wary helpful!!Yes, you might need this.
HiFi Loudspeaker Design
WOW there are a lot to learn, but it is funny, when someone like you, are willing to give me a push when I am stuck! 🙂
WOW there are a lot to learn
These drivers are really expensive. Maybe you could get some details on what PS Audio did with them.
Last edited:
Yes that's a great idea, I can't hurt to ask🙂These drivers are really expensive. Maybe you could get some details on what PS Audio did with them.
Last question (for now🙂 I am wondering if my Neo10 filter-result would be considered flat?
I am wondering if my Neo10 filter-result would be considered flat?
That curve is +/- 3dB, but it would sound not very neutral.
ok thanks🙂That curve is +/- 3dB, but it would sound not very neutral.
Hi mule,
normally the input picture should look somehow like this:

The impedance scale is on the right side of the graph.
You just proceed the same way as for the frequency responce.
The impedance curve is not mandatory for a simple (active) speaker design.
normally the input picture should look somehow like this:
The impedance scale is on the right side of the graph.
You just proceed the same way as for the frequency responce.
The impedance curve is not mandatory for a simple (active) speaker design.
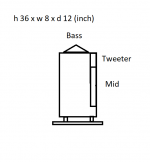
I am not sure I understand but just to show what I am thinking about, this small drawing.Hi mule,
normally the input picture should look somehow like this:
The impedance scale is on the right side of the graph.
You just proceed the same way as for the frequency responce.
The impedance curve is not mandatory for a simple (active) speaker design.
Everything is hollow inside and the bass goes trough the bottom of the speaker cabinet tube.
Attachments
VituixCad wants to know what the graph says so it can plot the impedance from it. You pick a number near the top of the graph and one near the bottom. You put the line on that level and enter the number beside it.high and low impedance, what does that mean?
Okay great thanks🙂VituixCad wants to know what the graph says so it can plot the impedance from it. You pick a number near the top of the graph and one near the bottom. You put the line on that level and enter the number beside it.
Is there any way to import the impedance graph, so it have all the infos?
Screenshot the data sheet, then open it in an editor. Select and copy the image so that it will be in the clipboard.
Yes like I do when importing SPL?Screenshot the data sheet, then open it in an editor. Select and copy the image so that it will be in the clipboard.
What next? 🙂
Same as SPL. The SPL buttons and boxes are on the left and the impedance ones are on the right. Don't use them at the same time.
Don't forget to set linear or logarithmic scaling.
Don't forget to set linear or logarithmic scaling.
Oh thanks, so that's what I do wrong!Same as SPL. The SPL buttons and boxes are on the left and the impedance ones are on the right. Don't use them at the same time.
Don't forget to set linear or logarithmic scaling.
So first Import SPL and ignore impedance, then export that part.
After that, import impedance and trace that and export that as a separate file?
WOW many thanks so much!!Yes.
About the "RE" what is that? There are low, high and RE impedance.
- Home
- Design & Build
- Software Tools
- What is SPL high and low impedance VituixCAD