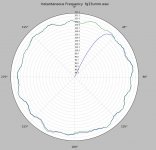
If I wanted to run the ~100Hz FG signal without manipulating it, is that possible? If I change the filter to 10Hz the plot looks too good to be true:
I increased the rez of the plot to .1Hz (I did fake the the maximum frequency since the code would have to be modified to not use only integer frequencies as the max). This is 10Hz and 20Hz filtering. The second seems like some 40Hz mains FM on the 100Hz?
Attachments
Last edited:
Testing 45 rpm is going to be a minority need. The 33rpm version can be used to check average speed at 45rpm by a simple calculation. Just making 1.8 a variable in the code is enough, allowing it to be changed in one place
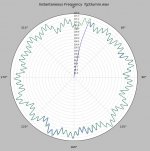
Last night I recorded the FG on one channel, and a WF track from a test record on the other. I think we can consider this line of experimentation fundamentally flawed; tapping in to the FG line is causing significant issues. This is the WF track from the same test record I've used for all the samples:
Attachments
Last edited:
Last night I recorded the FG on one channel, and a WF track from a test record on the other. I think we can consider this line of experimentation fundamentally flawed; tapping in to the FG line is causing significant issues. This is the WF track from the same test record I've used for all the samples:
Interesting similarity to the second plot above, the percentages of carrier line up. The tiny font at least made the tick marks readable. I never could find that command except in an example code, no documentation at all. I found a polar plot example where they were moved and looked for the likely line of code.
Last edited:
Thanks - indeed a bug for carrier frequencies below 200Hz.........(!!) Doesn't affect previous polar plots, this was the first at such a low carrier f......... who'd have thought it ?Something is amiss here
Murphy's law: if it can go wrong it will..........🙄
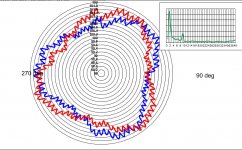
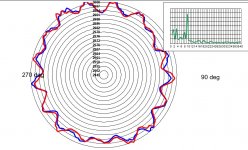
Here's a polar plot re-run of JP's 100Hz FG signal carrier raw data with that fixed, and looks conceptually plausible to me. Same essential shape and spectrum.......... so what does it mean, I'm pretty sure it's real ?
LD
Attachments
Last edited:
Would you kindly post the raw .wav file for the WF track if possible please, JP ? ThxThis is the WF track from the same test record I've used for all the samples:
LD
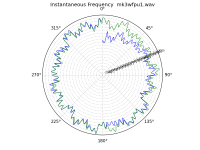
Thx - here's my edition of the polar plot for that file, starting at 10s.
Performance has, indeed, gone to the dogs through the act of measuring the FG signal, it seems.
Two spectral peaks in the WF file also seem to show up in the FG signal file, but by no means in the same ratio.............perhaps including the triangular like shape that isn't rotation synchronous...........
I agree, the FG monitoring method isn't good.
LD
Attachments
Last edited:
Thx - here's my edition of the polar plot for that file, starting at 10s.
Performance has, indeed, gone to the dogs through the act of measuring the FG signal, it seems.
Two spectral peaks in the WF file also seem to show up in the FG signal file, but by no means in the same ratio.............perhaps including the triangular like shape that isn't rotation synchronous...........
I agree, the FG monitoring method isn't good.
LD
I'm almost certain the 40Hz wiggles are real in my plot, the sidebands showup in a standard FFT though they are too noisy to discern AM from FM. IMO they are from 100Hz/60Hz beat though I am somewhat at a loss as to the details of these data sets.
To understand it, I think one needs to know detail of the drive design intention. Which I don't, but I'm sure someone here might..........?
Here we're on a bit of a detour, examining the FG signal of a particular TT drive, which proves to be tricky to interpret - no surprise I suppose.
One feature is the triangular pattern in the FG polar plot that's not synchronous with rotation; another is a ~9Hz pattern which is synchronous.
If we were looking a polar plot of pitch variation, we might tag those markers and relate them to the mechanism. That's how diagnostics and fixes can work using polar plots, IME.
However, this case at hand is a healthy TT by standards. At least until the FG probe was introduced 😉 So really we're exploring how the TT drive works, and what (if any) residual artefacts of the drive might remain - which is ethereal stuff methinks.
LD
In broad strokes the phase of the motor's frequency generator output is locked to the phase of the reference. Phase difference produce an error voltage that the drive then uses to adjust the speed. The whole thing is essentially a PLL. The 100Hz signal is what we're interested in, the rest is noise.
I went down this path as another angle in the pursuit of isolating test record/arm/cartridge issues as the FG signal from the motor is an ideal method to do this. However, in this case the data is full of noise and the 'table isn't running correctly due to where/how I probed it.
Probably best to move on.
Hi Scott, would be great to see a plot of the FM spectrum, don't you think ?I increased the rez of the plot to .1Hz (I did fake the the maximum frequency since the code would have to be modified to not use only integer frequencies as the max). This is 10Hz and 20Hz filtering. The second seems like some 40Hz mains FM on the 100Hz?
All one has to do is a fourier transform of the display data as a time series, and calibrate the x axis according to the time spacing.......... the y axis would FT bin magnitudes, corresponding to display content spectrum.
I think this is pretty much essential to interpretation and diagnostics, one can't get far without needing to indentify the contributing factors in all but the most obvious cases.
HTH !
LD
One more rev, I removed all dependencies on outside libraries and added a prompt asking for a .wav file to process (must be in quotes). All you have to do is change the HOME directory in the script to wherever your files are that you want to process. If you wanted you could make sure they are in the search path for Python or enter the full path name (I find this a pain).
Wicked fast now plots the instant you hit return, save for the first time where it needs to load all the libraries.
Many thanks for the code Scott. Finally managed to get to grips with the world of Python and get it to run. Out of interest, I will run some of my own Lenco .wav's tonight and compare them to the ones from the software I have previously been using.
Regards,
Probably best to move on.
JP, Do you have a suggestion that works in both Python 2.7xx or 3.0xx for the input file name without quotes?
Raw_file by itself works in 2.7 but if quotes are used it breaks. I can't get eval() to work for single and double quotes if the input is already a string, while either single or double work for input(). I don't do much with user input usually just some simple numerical input. I don't have a way to check Python 3 but want to make sure everything works in both.
If the input can't already be an arbitrary string so be it (yes this is a sort of trivial matter).
The filter glitch went away with the initialization function.
Last edited:
Hi Scott, would be great to see a plot of the FM spectrum, don't you think ?
LD
Yes this is not hard especially since I can preserve the sample frequencies exactly through the arbitrary N FFT. I could plot it next to the polar plot as another figure on the same canvas.
I'm holding off on any new revs because I want to make sure about the compatibility with Python 3 and input, as is I think it works with both but requires quoting the filename.
I have a better post filtering strategy that both keeps the glitch at 0 degrees low and has no group delay when you want to filter heavily like at 20Hz. This is a small issue but the wiggles rotate 5-10 degrees clockwise as you lower the filter frequency without it.
EDIT - To be clear JP's suggestion works fine for me, if the same thing also works in Python 3 I would just leave it even though if you type or paste in a name with quotes it won't work.
Last edited:
Scott, I'm running 3.6. I've never used python before - finding the no-quote work around was inspired by me consistently forgetting to type the quotes.
The only issue I had was with matlibplot not recognizing set_rlabel_position. It appears it may be deprecated, replaced by set_rgrids.
The only issue I had was with matlibplot not recognizing set_rlabel_position. It appears it may be deprecated, replaced by set_rgrids.
Scott, I'm running 3.6. I've never used python before - finding the no-quote work around was inspired by me consistently forgetting to type the quotes.
The only issue I had was with matlibplot not recognizing set_rlabel_position. It appears it may be deprecated, replaced by set_rgrids.
OK I just checked, the no quotes thing works all around just now you can't use quotes absent mindedly. It's easier on the user I'll just put a reminder in the prompt.
I'll check my install for set_rgrids still fairly poor documentation out there.
Thanks!
EDIT - Thanks again, the built in editor gives a prompt on what every built-in function expects so I was able to figure out how to fix the radial labeling for everyone.
Last edited:
As Pano said, I was thinking use the second channel as a guide for grabbing your frames. Should be easy to get a few msec 1V blip every rev.
Moved a bit over a year ago and can't find my stash of Arduino-type stuff, so I had to order some stuff. Hopefully I can get some stuff captured this weekend.
I'll probably use a DDS to generate a tone, as that'd be an easy tweak to some code I've already written, and it makes things a bit more interesting. That said, would it be of use to record a tone for a platter rev, and one for a record rev? Say 1K for platter and 10K for record? That way we'd know the exact relationship of the record and platter.
- Home
- Source & Line
- Analogue Source
- Turntable speed stabilty