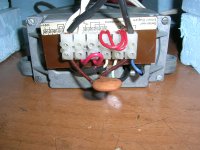
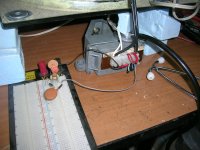
we tuned the AC motor phase shift capacitor. Worth.
I agree. It worth the effort.

George
Attachments
I got the STD working again - no major change in the trace except the average speed is now correct and I can see the cartridge kicking sideways at one point, so a that is pressing defect on my HFS75.
A second Elipson test record is even worse, with low frequency signals larger than the 3.15kHz tone
I tries a static capture with the motor off and found high levels of 24Hz and 30Hz. These must be from a fan and I can see those on my 3kHz trace
A second Elipson test record is even worse, with low frequency signals larger than the 3.15kHz tone
I tries a static capture with the motor off and found high levels of 24Hz and 30Hz. These must be from a fan and I can see those on my 3kHz trace
George - the voltage the capacitor can be more than 240V, thanks to LC resonances. Your capacitors look like they may not have a high enough voltage ratingI agree. It worth the effort.
George
For ultimate speed up of filters, remove them! They're not needed, no compromise.
LD
No sorry you win, the Hilbert transform is just too sensitive to noise because it is an FFT of the full 1.8sec. The plots shown filter the frequency data at 100Hz with 4 poles to reveal the low frequency wobble underneath. I'm sure your short transform technique actually is effectively filtering and has a BW limit on its output. Nothing of interest is compromised though IMO. 🙂
Your capacitors look like they may not have a high enough voltage rating
Thanks David.
These test capacitors you see are marked as 500V.
As they are not AC line rated, this voltage marking refers to DC.
The original cap was 250V AC.
Have you checked with an oscilloscope the peak to peak voltage under resonance? ( I haven’t).
George
One more rev, I removed all dependencies on outside libraries and added a prompt asking for a .wav file to process (must be in quotes). All you have to do is change the HOME directory in the script to wherever your files are that you want to process. If you wanted you could make sure they are in the search path for Python or enter the full path name (I find this a pain).
Wicked fast now plots the instant you hit return, save for the first time where it needs to load all the libraries.
Wicked fast now plots the instant you hit return, save for the first time where it needs to load all the libraries.
Attachments
Just playing around with this a bit.
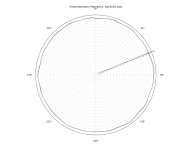
The FG on the MK3 is ~100Hz @33. I changed the speed of the captured file x10 in Audacity, and then changed Scott's code so that .18s = 2pi radians.
Original file: Dropbox - fg33um.wav
The FG on the MK3 is ~100Hz @33. I changed the speed of the captured file x10 in Audacity, and then changed Scott's code so that .18s = 2pi radians.
Original file: Dropbox - fg33um.wav
Attachments
The radial ticks look like they are at the default 22.5 degrees. There should be a line setting them at 90, did you comment it out or skip it? Looks like things still make sense.
My install of the plot library doesn't like set_rlabel for some reason.
I see, the polar plotting is recent and poorly documented folks are gradually trying to get things that don't work x,y the have a radial equivalent.
If you add this:
You won't have to use quotes for the input filename.
Code:
try:
	input = raw_input
except NameError:
	pass
You won't have to use quotes for the input filename.
Indeed, I have a different method: break down the file into short consecutive short timeslots, transform to frequency domain, detect tone frequency for each timeslot and that's the result. The trick is to have an excellent detector for short transforms.No sorry you win, the Hilbert transform is just too sensitive to noise because it is an FFT of the full 1.8sec. The plots shown filter the frequency data at 100Hz with 4 poles to reveal the low frequency wobble underneath. I'm sure your short transform technique actually is effectively filtering and has a BW limit on its output. Nothing of interest is compromised though IMO. 🙂
FM bandwidth ends up about 100Hz, and display filtering takes this to about 60Hz IIRC. There's not much content above about 40Hz, IME, in the scale of things.
In this method, LF baseband noise really doesn't matter, the transform takes care of it and frequency domain results are quite separate from the tone.
To obtain an inset FM frequency spectrum graph, I just take a FT of raw display data and display the result. IMO, this is essential to help diagnose causes of pitch instability, and I have some time today to get my head around displaying the magnitude units sensibly...... I've got by because knowing the frequencies at issue is the key to diagnosis IME.
LD
In this method, LF baseband noise really doesn't matter, the transform takes care of it and frequency domain results are quite separate from the tone.
LD
I figure it's the fact that the FM spectrum in its raw state has 48k BW, LF noise does not seem to affect things here either. I tried some FM graphs they looked about the same as yours but I would try more revs to get more resolution.
Last edited:
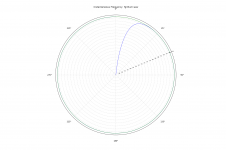
If I wanted to run the ~100Hz FG signal without manipulating it, is that possible? If I change the filter to 10Hz the plot looks too good to be true:
At 10Hz the filter transient gets pretty long for one thing, also as Pano said to make a large frequency range useful one would want to adaptively adjust the ticks. You could try again changing the 3's in the tick step formula to something smaller. Another problem is that group delay in the filter starts to distort the positions of the wiggles at low frequencies. Trying the linear phase back and forth IIR is also on the table.
The filter transient issue is important enough that the signal processing package has several functions to preset the filters to reduce it, I might give that a try as well as adding the no need for quotes.
A question for everyone, what about 45RPM tune ups?
Last edited:
For a start the 1.8 seconds = 2pi radians all over your code becomes 1.33333 or 4/3A question for everyone, what about 45RPM tune ups?
Thanks, the FG signal is very interesting JP.Just playing around with this a bit.
The FG on the MK3 is ~100Hz @33. I changed the speed of the captured file x10 in Audacity, and then changed Scott's code so that .18s = 2pi radians.
Original file: Dropbox - fg33um.wav
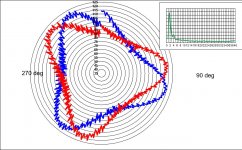
Here's the FG signal polar plot, directly from your raw file JP using my software. 2 successive revolutions.
I'm not sure if the dither/flutter is real or an artefact of working at such low carrier frequency - I haven't tried it before this thread but it should work and the result looks plausible enough.
Very interesting, and very pretty 🙂
Thanks again
LD
Attachments
Last edited:
Thanks, the FG signal is very interesting JP.
LD
Something is amiss here, examining the file in CoolEdit I don't see anything that would indicate 20% FM?
For a start the 1.8 seconds = 2pi radians all over your code becomes 1.33333 or 4/3
I was more wondering how to incorporate that, two separate scripts or a prompt to the user since this info is never in the file.
- Home
- Source & Line
- Analogue Source
- Turntable speed stabilty