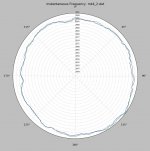
Here's the polar plot for that file, JP, an SL-1200 MkIII.
2 revolutions, starting at 10s in the file.
It is, once again, near as good as it gets, perhaps. The pick of a very good bunch. If one is super-critical, there's a slight flattening near 5 o'clock - similar events cropped up in the other files IIRC, so perhaps the test record is implicated ?
Again, the green inset spectrum auto-scales so only useful for pointers as to causes of variation, not how big they are in absolute terms.
All very good - what was the cart/arm for this one, JP ?
LD
Attachments
LD - That noise file is brutal, I don't how that bad of an SNR would apply except in some other scientific fields. Here is a plot of a 20dB SNR pink noise which is already unlistenable. So there's a difference, I posted yesterday a plot that showed filtering out the low frequency noise on a real data set made no detectable difference,
The glitch remains annoying, I'm sure there is a way to smooth the start of the IIR filter.
The glitch remains annoying, I'm sure there is a way to smooth the start of the IIR filter.
Attachments
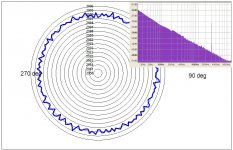
Yes, it's insanely unrealistic - I was exploring performance of the detector from the point of view of finding the threshold at which noise became significant. Attached is an archive polar plot for that file that also shows an inset with the spectrum of the synthesised test file. Brutal......LD - That noise file is brutal, I don't how that bad of an SNR would apply except in some other scientific fields.
As you say, baseband noise rejection performance is such that one can be confident the detector is accurate and noise free in any real playback situation.
A consequence is that click rejection is excellent, as you've also found.
Yes, I use no filtering and there's no compromise - just use raw data.I posted yesterday a plot that showed filtering out the low frequency noise on a real data set made no detectable difference.......
An accurate result should obtain from the first data slice, subject to smoothing...... otherwise just start the display plot slightly later..... ?(!)The glitch remains annoying, I'm sure there is a way to smooth the start of the IIR filter.
All good stuff !
LD
Attachments
A consequence is that click rejection is excellent, as you've also found.
Yes, I use no filtering and there's no compromise - just use raw data.
LD
Yes, I was referring yesterday to the noise in a real data file while using the Hilbert transform, since this method uses the entire waveform the answer degrades fast at poor SNR but no real LP should even get close. For the same reason the output has noise at the full 48K BW so post filtering is necessary, though I do make the assumption that this just works. The graph orientation is now correct and a repeat on that file now matches very well. Any idea what the effective BW is of the displayed data?
I will simply take 2 seconds of data and trim .1sec off each end. It will remain simple (with a little care) to keep multiple revolutions abbuting. In general I would think there could be a small discontinuity due to DC drift of speed but I don't see it in your plots (maybe it's too small).
I should finish tomorrow and will put up a .pdf.
Last edited:
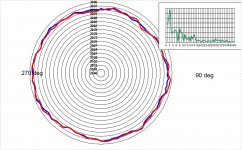
Here's the polar plot for that file, JP, an SL-1200 MkIII.
2 revolutions, starting at 10s in the file.
It is, once again, near as good as it gets, perhaps. The pick of a very good bunch. If one is super-critical, there's a slight flattening near 5 o'clock - similar events cropped up in the other files IIRC, so perhaps the test record is implicated ?
Again, the green inset spectrum auto-scales so only useful for pointers as to causes of variation, not how big they are in absolute terms.
All very good - what was the cart/arm for this one, JP ?
LD
Could be - it's the same test record for all of them. This is another SP-10 MK3 with the same B500/A505 arm, though with a P205CMK4 cartridge.
Realtime analysis would allow the test record to be rotated a little to see if the wobble moves. Make the software run on a Pi and it could be used to trigger a strobe light to mark 0 degreesIf one is super-critical, there's a slight flattening near 5 o'clock - similar events cropped up in the other files IIRC, so perhaps the test record is implicated ?
LD
Test records are going to become very valuable
OK, couldn't stop. I decided to all the revolutions at once and just pad the beginning to eliminate the glitch. Compare to post #346, scarey close.
BTW it is confusing as you advance into the file the plots move counterclockwise.
BTW it is confusing as you advance into the file the plots move counterclockwise.
Attachments
Last edited:
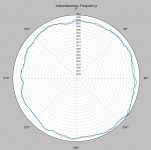
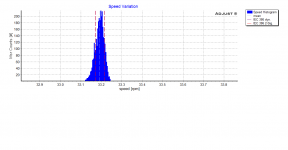
Coming late to the party, but I'd like to show some measurements in this context with the Adjust+ test system.
It indeed looks horrible compared to what we normally see from an electronic component!
Jan
It indeed looks horrible compared to what we normally see from an electronic component!
Jan
Attachments
Coming late to the party, but I'd like to show some measurements in this context with the Adjust+ test system.
It indeed looks horrible compared to what we normally see from an electronic component!
Jan
The conversion between the two displays is pretty easy, it might be easier to eyeball the off center component from the polar display. If you could sync the platter to display the offset would convert directly to mm and direction.
Last edited:
I should finish tomorrow and will put up a .pdf.
Can't wait
I took your old code listing and figured out what is happening. It runs straight away as Python3
Good work all around! Pun intended. 
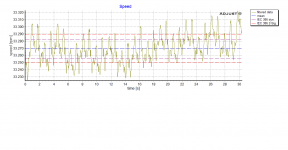
I mention again that seeing this graphed as a percentage would very nice indeed. Not to hard to figure it from the frequency, but just having it on the graph would be superb.
I mention again that seeing this graphed as a percentage would very nice indeed. Not to hard to figure it from the frequency, but just having it on the graph would be superb.
There is some great work happening here, keep it coming!
Hope no one minds but I processed the above sound file using the software I was given by the guy who used it on the Pink Fish Media Thread – see http://http://www.pinkfishmedia.net/forum/showthread.php?t=70027.
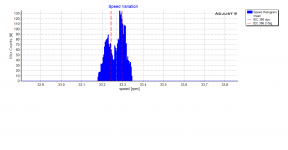
The polar plot does not give absolute values but as the software exaggerates any errors, such are readily apparent. The two FFT plots are, with respect to frequency, absolute values. The FFT Demodulated one was of particular use in sorting my Lenco out. I have also added an Audacity FFT plot of the sound file.


From my experience the results are very good and it would be hard to better. Only things to note are that the TT is running slightly slow (nominally 2996Hz (-.13%)), there is a slight peak at 16.5 Hz (which is apparent on LD’s FFT plot as well) and the Test LP is very slightly off centre (not a TT failing!!). It would be good to see a PlatterSpeed app result for this TT.
I hope this is of interest.
Regards,
Hope no one minds but I processed the above sound file using the software I was given by the guy who used it on the Pink Fish Media Thread – see http://http://www.pinkfishmedia.net/forum/showthread.php?t=70027.
The polar plot does not give absolute values but as the software exaggerates any errors, such are readily apparent. The two FFT plots are, with respect to frequency, absolute values. The FFT Demodulated one was of particular use in sorting my Lenco out. I have also added an Audacity FFT plot of the sound file.
From my experience the results are very good and it would be hard to better. Only things to note are that the TT is running slightly slow (nominally 2996Hz (-.13%)), there is a slight peak at 16.5 Hz (which is apparent on LD’s FFT plot as well) and the Test LP is very slightly off centre (not a TT failing!!). It would be good to see a PlatterSpeed app result for this TT.
I hope this is of interest.
Regards,
A suggestion.....
Thanks to Scott for taking on this project and sharing his results!
If you plan to share the source code with the public, maybe you could split this off into a separate thread and make it an open source project? People could add to, or modify the program with enhancements, and after the field has tested and approved them, the OP (Scott) could update the first post with the latest (approved) version, so he would have document control of the project.
Its easy to calculate and display percentage rather than absolute frequency, but should this be against nominal or mean actual value?I mention again that seeing this graphed as a percentage would very nice indeed
I am suspecting that SP10 owners might be actually measuring the cutting lathe and the test record producers signal generator.
Creating accurate test signals in 1975 when HFS75 was released was expensive, these days we just run Audacity.
@davidsrsb, I've around a dozen test records. I'll try to record a few this weekend on the same 'table for comparison.
@davidsrsb, I've around a dozen test records. I'll try to record a few this weekend on the same 'table for comparison.
I used this record for checking TT speed recently for the first time -

It gave a frequency of 2938Hz on a DD TT which did surprise me (it should have been 3000Hz). Cross checking with other test records proved the lower frequency was due to the record and not the TT; I will not be using it again!
Can't wait
I took your old code listing and figured out what is happening. It runs straight away as Python3
Ok here's the code in plain text format, I've commented it and removed any hard dependencies on sampling frequency so any sampling frequency should do the right thing. Also one last plot run on this exact code with file label added (compare to plot in post #346).
@ Pano that's a good idea and it would not be difficult, but a little work to get 3K, 3.15k, and even 1k to work as the base frequency.
Attachments
Good question - for which I don't have a good answer. Your thoughts?Its easy to calculate and display percentage rather than absolute frequency, but should this be against nominal or mean actual value?
Same thing I was thinking, you beat me to it. 🙂 How good is the lathe and the cutting head, not to mention the generator? How can we know? Fortunately JP may provide the answer below.I am suspecting that SP10 owners might be actually measuring the cutting lathe and the test record producers signal generator.
A big step in the right direction. How difficult would it be to sort out the table artifacts from the LP artifacts? Anything that appears across all recordings should be TT specific, shouldn't it?@davidsrsb, I've around a dozen test records. I'll try to record a few this weekend on the same 'table for comparison.
We did a similar test with record wear, George using a Shure cart at the beginning and end of the test run, with a Stanton in between. That worked well.
Thank you Scott, that's very tidy and results look excellent.Ok here's the code in plain text forma
I'd guess that Python library function performance is, in practical terms here, at least as good as the one I came up with - and certainly more compact from a coding perspective ! So I think this outcome is, pragmatically, far more useful.
Though I doubt my algorithm is original, I'm very happy to see the Python library supporting a function that, in this application, appears to at least match performance. Next time, I'll look there first (!!)
Well done indeed, this takes the art forward !
LD
- Home
- Source & Line
- Analogue Source
- Turntable speed stabilty