>Stated zero degrees...what does that mean..the current and mag field vectors appear to be max, which s/b 90 degrees into the sine.
The vector lengths/color map resize/normalize themselves with zoom or a new solution, you’ve got to set scale factor manually for comparing; current crowding visually appears max near 0 phase in this system, impedance phase angle ~80 degrees; |inductance| ~6x r_dc with these big (~12 AWG) wires at 20 KHz, this sim uses V source excitation so the current is shifted re V. I have used isource too, it gets confusing…
>Does this software have the capability of analyzing a linear ramp current of say 10^3 to 10^6 amps per second?
Yes, excitation current (and fields, potentials or V/M) can be described by user defined f(t); I’ve seen steps, sines and sawtooth in example sims
>Is it capable of doing a section 90 degrees to the shown plot? IOW, show current density axially? In both the axial, and radial direction?
This is a 2D sim, infinite z axis, solutions have no z axis variation (excitation is normalized value V/m or a current along z axis), you can easily plot current density (or a host of other field var: A,H,B Poynting, energy density, ect ) along the x axis, or other defined “edge” in the 2D plane
>Can you set a boundary condition on the previously mentioned section, where the material suddenly changes either conductivity or permeability...what I have in mind is viewing the vector components of the eddy currents within the wire..As I suspect that superimposing a uniform current density on a reaction current plot (remember, mag field is linear with distance from center of wire) will produce the same current density as the bessels.
Yes for 2D, sections with uniform, infinte z extent (or axisymetric )
Shouldn’t electric field lines be the current flow gradient inside linear conductive material? electric field is one of the standard plots
>My intent is to simulate a linear ramp, showing the current profile as ramp rate dependent..and, I have a gut feeling that using the typical e/m wave penetration analysis for skin depth is not correct..don't know how to express that yet, but I trust my gut..
>It of course, has to fit existing measured results..
>I fear no simulation package is capable of doing what I want, and I will be forced to write a whole mess o' code to realize this wish..doable, but it sucks..visual basic ain't exactly the most "tight" with variables, truncation errors have the most "wonderful" characteristics..been bitten by that floating point bug during mag field simulation before.
Yes I certainly can’t vouch for this software’s accuracy; I’d like to compare harmonic and transient results for consistency for a start
>Oh, BTW...if you increase the frequency to say, 100Mhz or 1000 Mhz...do the reverse rotation magnetic vectors disappear, as well as the negative currents in the middle? When the conductor is fully skinned, current maxwell theory states that there is no internal magnetic field, or current..So, that would be a good test of the simulation software capabilities..
I have increased conductor u_rel 100X and do see current pushed to thin surface layer, too thin for my present mesh actually, some obvious lumps due to the meshing – which is limited to ~ 200 elements for free/student version (they offer to run emailed prob from student version with high res mesh and return results)
>Cheers, John
>PS..sorry guys...no really cool picture to put here..maybe somebody else??
me too; I’m tiring of cut and paste, trying to fit forum’s size limit and convey good info
I don’t worry about skin effect in audio reproduction, but do like to see a higher level of engineering exchange where I need some thought to keep up - I'm not likely to reformulate EM theory any time soon though
Thanks for the timely replies..
I will, unfortunately, be thinking about this big time while no vacation..can't help it.
Also thinking about what it will take to model it in 3 D..
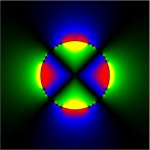
Here's a pic of the field map of a quad magnet..Turned out that the field map calculations weren't the hardest part of this..it was the code to map field strength against false colors..Hey, if ya gonna make a pretty picture, ya gotta make it visually symmetrical.
It was made using a 2 d cross section of a superconducting magnet, and the colors represent the azimuthal component of the magnetic field. Yellow, for example, is field intensity in the clockwise direction, while red is counterclockwise..
Unfortunately, it is only static code..to make it capable of dynamic simulation, with 3 d inclusion is probably gonna be a tad more difficult.
(sorry, I just had to put a cool pic up..couldn't resist)
Cheers, John
I will, unfortunately, be thinking about this big time while no vacation..can't help it.
Also thinking about what it will take to model it in 3 D..
Here's a pic of the field map of a quad magnet..Turned out that the field map calculations weren't the hardest part of this..it was the code to map field strength against false colors..Hey, if ya gonna make a pretty picture, ya gotta make it visually symmetrical.
It was made using a 2 d cross section of a superconducting magnet, and the colors represent the azimuthal component of the magnetic field. Yellow, for example, is field intensity in the clockwise direction, while red is counterclockwise..
Unfortunately, it is only static code..to make it capable of dynamic simulation, with 3 d inclusion is probably gonna be a tad more difficult.
(sorry, I just had to put a cool pic up..couldn't resist)
Cheers, John
Attachments
SY said:You just put me into an epileptic seizure.
Then I have accomplished my goal...my work is done here..
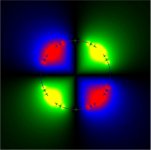
Here's the same field, but this time it's the radial component of the field..this time, yellow indicates field pointing outward, red is pointing inward..
Cheers, John
Attachments
Just wanted to say that in the short time I've been here, I have been impressed by the people posting.
I look forward to more when I return..
BTW..I've been discussing skin theory with my "scary" friend..he looked at me like I had two heads..he can't understand why I would even have considered defining skin by the impinging of a wave on the conductor surface, propagating inward at slow velocities..of course, it's the reaction of the conductive volume to the b dot field, what else could it be..😕
Like I said, he scares me..but, man can he do that math thing...
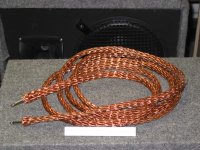
Oops, almost forgot a pic.....
Now, THIS is a properly shielded cable..that's a six inch ruler leaning against it, and a 12 inch woof behind.
Cheers, John
I look forward to more when I return..
BTW..I've been discussing skin theory with my "scary" friend..he looked at me like I had two heads..he can't understand why I would even have considered defining skin by the impinging of a wave on the conductor surface, propagating inward at slow velocities..of course, it's the reaction of the conductive volume to the b dot field, what else could it be..😕
Like I said, he scares me..but, man can he do that math thing...
Oops, almost forgot a pic.....
Now, THIS is a properly shielded cable..that's a six inch ruler leaning against it, and a 12 inch woof behind.
Cheers, John
Attachments
Hi,
Once you're in the Caribbean you'll see a lot more of those braids...
No idea what those sound like...
While you're over there, flights across the islands are really cheap and worth every cent.
If you want to make it all the way to Saint-Vincent (Grenadines) I can even call on a friend to host you.
Have a nice trip,😉
http://www.circuitsage.com/tline.html
contains link to: http://www.wheeler.com/technology/technicalpaper2/technicalpaper2.pdf
"Skin Effects models for Transmission Line Structures using Generic
SPICE Circuit Simulators"
might be able to fit to two-wire cable sim Z# from QuickField magnetic harmonic analysis...
contains link to: http://www.wheeler.com/technology/technicalpaper2/technicalpaper2.pdf
"Skin Effects models for Transmission Line Structures using Generic
SPICE Circuit Simulators"
might be able to fit to two-wire cable sim Z# from QuickField magnetic harmonic analysis...
jcx said:http://www.circuitsage.com/tline.html
contains link to: http://www.wheeler.com/technology/technicalpaper2/technicalpaper2.pdf
"Skin Effects models for Transmission Line Structures using Generic
SPICE Circuit Simulators"
it is indeed very intuitive and makes a lot of sense.
has anyone tried real numbers on this?
how the big boys do it:
http://www.techonline.com/community/ed_resource/feature_article/14767
and brain numbing math applied in the name of “simplified” modeling:
http://rleweb.mit.edu/vlsi/publications/pub162.pdf
and a book I will look out for (sounds complex enough for me):
http://www.amazon.com/exec/obidos/tg/detail/-/0130289043/002-8730724-0988007?v=glance
jcx said:
Nice writeup.. two points..
PEEC assumes a uniform current density within the bars..and, it assumes rectangular busbar cross sections..
Also, in figure 6, the free space magnetic field is rather interesting..
Between the conductors, the field doesn't drop off in a 1/r fashion...Hmmm... it even drops off slower than linear near the conductor..wonder if the square section is the reason for that..
I note that there is no inverted magnetic field in the conductors, even they show skinning..again, hmmmm..
Thought bout this issue for a week...I really am not happy that some modelling programs are showing reverse current in the middle of conductors, regardless of frequency...trying to decide how real that is..same with the reverse rotation magnetic field..
Cheers, John
Hoo Boy...modelling is a "fun" thing
Going through the conceptual part of some code to model wire current density. Interesting...major points:
It will be an iterative code..starting with a basis of uniform current density during current slew.
From there, calculate the flux within the wire..
Then, the flux rate of change vs radius.
Then, the circular eddy currents vs radius.
Then, add those eddy currents to the main flat section current.
Then, normalize the integrated current by level shifting.
Then, using the resistivity of the conductor and the current density profile, modify the current density inversely w/r to the current density. (I think this is the important step during normalization, as without it, I think the iterative process will cause all current to skin regardless of conductivity, resulting in non convergence under any conditions.) And, during this step, I can include the Jc of a superconductor, with it's current density limitiation..
Sorry for the lack of pictures to detail the steps I'm talking of..I've been too busy getting into the swing of things again..Once I make some pics, I'll be able to go into the technical details..just words alone is not amenable to a real good understanding.
BTW, this model concept does not allow for negative currents within the conductor at the center...that is inconsistent with existing software modelling packages...I do not know if it is the fault of the commercial packages, or if I am missing something. It may just be the commercial packages are assuming sine wave excitation, where I am using current slews..
Once my code is up and running (and convergent), I'll match it against the two mag analysis packages we have here. (oh, almost forgot..I'll make sure it makes neat graphics...gotta have those!!!!)
Ahhh..had fun in Bermuda, riding a moped...everywhere....Almost as much fun as bicycling in Nantucket (PT?) But, the 50cc stuff is so wimpy, not like my old suzy 550...
Cheers, John
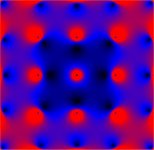
Starting the coding process for mag field visualization. Initial code is only for static fields..(hey, gotta walk first).
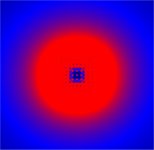
Rather than integrating uniform current densities, I've setup the code using discrete current wires..points on an array. The first pic here is of 81 wires in a 9 by 9 array of wires, all the same current. This pic is far field absolute value, showing the falloff of field flux density w/r to distance from the square array. Note that in the middle of the pack, the field has started to drop..
Rather than integrating uniform current densities, I've setup the code using discrete current wires..points on an array. The first pic here is of 81 wires in a 9 by 9 array of wires, all the same current. This pic is far field absolute value, showing the falloff of field flux density w/r to distance from the square array. Note that in the middle of the pack, the field has started to drop..
Attachments
This is a closeup of the middle of the 81 wire array. The black dots are the wires, as I prevent the calcs very close to the wire due to 1/r field strength. Because of the discrete model, the flux pattern is artificially granular..to get rid of this, more wires are needed. What is important here is the way the flux is showing around the wires, which is consistant with theory so far..
Attachments
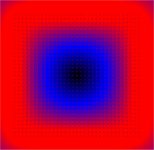
Here is an array of 6400 wires, but I have excluded all wires over 4 inches out, and under 3.8 inches, leaving a cylinder. Of note is the lack of field within the cylinder..(the green splotches are just artifacts of the model..) This is the type of current density that is supported by a heavily skinning conductor..NO flux on the inside of the wire, hence, no internal inductive storage.
Attachments
This last pic is a closeup of part of the shell of wires. Again, all the swirly field stuff is just an artifact of the individual wires, not a real thing..
I don't have any more stuff in the code yet..No field auto-scaling, and the feature I want is to see the flux intensity along a line I define, as well as the integrated inductance from the center of the wire to 10 diameters away. to show the linear flux relation inside, and 1/r outside...Another day...another transmission (sorry, major bummed out with my voyager...doesn't shift..
I'll probably add in mag vector lines, to show flux directions.
Cheers, John
Attachments
This scan is of the 6400 wire array, excluding all wires out of the 4 inch diameter. Although there are slight ripples, it's clear that the resolution is rather good, and that the flux at the center of any wire carrying dc is zero, with it increasing up to the surface of the wire.. next code mod will have the line scan, allowing the actual flux magnitude plot, and hopefully, the integrated inductance from the wire center out..
Cheers, John
Cheers, John
Attachments
Cheers, John
still lookin, please keep it up
if i wanted to go further than just looking at the QuickField FEM pix, i would try to fit the FEM impedance vs frequency data to a low order model (< 10 elements?) - just coincidentally i picked up "System Identification: A Frequency Domain Approach” for work
Cheers, john
jcx said:Cheers, John
still lookin, please keep it up
if i wanted to go further than just looking at the QuickField FEM pix, i would try to fit the FEM impedance vs frequency data to a low order model (< 10 elements?) - just coincidentally i picked up "System Identification: A Frequency Domain Approach” for work
Cheers, john
Thanks...was gettin lonely out here...😀
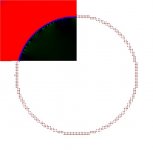
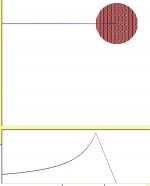
Here's a scan of the flux magnitude on a line to the center of the wire. I scaled the view to give a clearer farfield behavior.
Of interest here is the way the flux behaves..Note that outside the wire, the flux falls off as 1/r...but, within the wire, the flux is linear, starting at zero in the center of the wire, and increasing up to the surface of the wire..
If I include a mu in the wire, the linear ramp will scale..mu=100, ramp is 100 times steeper, with a discontinuity at the wire surface. But that addition will come later.
I've been keeping the processor time down with the hi wirecount runs by limiting the area computed..scans are 800 by 800 pixels, with 6400 wires contributing to each pixel field, in both x and y directions. So, speed is quite low. As the code gets more options, I'll bite the bullet and go for huge runs..
Cheers, John
Attachments
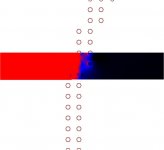
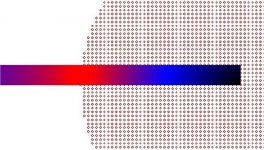
Now...for some two conductor plots...I was hurried, so they are square, but the plots are close to the round plots..
First, two wires, opposite polarity..
This is an ABS plot..
Note the 1/r external decay...and the enhancement in between..
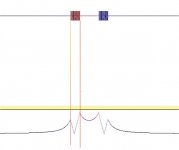
I drew in some vertical lines to bracket the in wire area. Notice the flux drop is linear still. But, notice that the zero point is no longer symmetrical..it is being forced away from the other conductor.. also note the in between field..
John
First, two wires, opposite polarity..
This is an ABS plot..
Note the 1/r external decay...and the enhancement in between..
I drew in some vertical lines to bracket the in wire area. Notice the flux drop is linear still. But, notice that the zero point is no longer symmetrical..it is being forced away from the other conductor.. also note the in between field..
John
Attachments
- Home
- General Interest
- Everything Else
- The Skin Game