Took me quite some time wesayso over in Rephase create a precision reverse phase as seen below, think there's a chance VituixCad or REW could have output a IR wav file in few minuttes and saved me some hours its just that i feel most save using the tested IR format i get out of Rephase. Have sent few convoluted test tracks via PM so look forward feedback from critical ears and take your time. Know your ears are sharp so hints for test is not needed but can't stop say try listen for rhytm or beat between musicians in Robben Ford track Revelation, its mostly in start of track where bass and rhytmic section never is in 100% beat on most replay systems, where if one hear that band live man i tell they are musical swinging and 100% on beat with each other, seen them perform live in past myself a few times, one was a small arena and the best one in a small pub.
Attachments
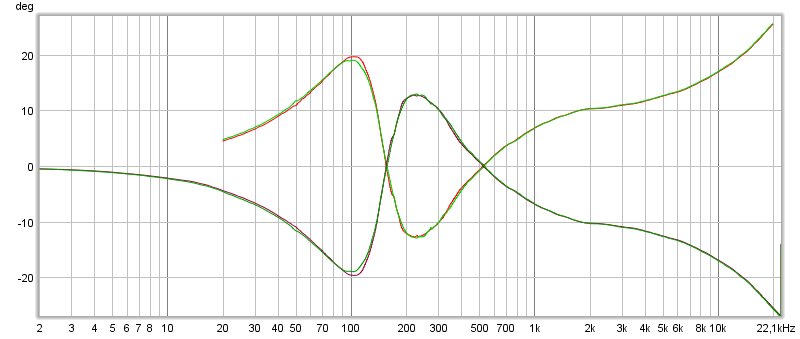
Re. the STEP response.... long winding answer, but loving it! 🙂
Thanks for the detailed posts.
I get that tonal balance should be important, but, so far, the only speakers I heard that really *moved* me where a good FR with a phase and time coherent STEP.
When I hear speakers that have good FR, I go like, "yep, that sounds alright.'
But if they have a STEP looking close to the Dunlavy ones, I get transported by the music.
It's more like a feel for the music than what the ears seem to get. It gets me to another level of appreciation.
Do I make sense? As with all things audio, it's hard to explain the feeling of listening to something that is pleasing to me.... may not be the same thing for the other listeners sitting besides me...
Probably the same thing as trying to describe how a good wine (to me) tastes.
perceval,
Don't know if info can help give you good wine : ) but bet if we visited and listened wesayso's towers you probably say stunning or close to die for : ) if we then visited Jim that posted pages back we get same result or better : ) or what about a demo room with BeoLab 90 : )
What that should tell us is 2nd or 4th order XO are not that evil its implementation and build execution. Actual to find answers before taking desicions you can research in try convolute few tracks including 2nd and 4th order filters, play them back over a full ranger and you probably can't tell a difference where in head phones you probably could notice a bit. If that goes as i imagine we should be able conclude that its not those filters by themselves that makes us conclude if we haven't a nice triangle in SR plots its bad, no its because we don't have as perfect a implementation and execution of those system filters as there is into those convoluted tracks.
Last edited:
I really do hope that an Europe trip is getting planned in a near future...
I'd love to have a listen. 🙂
I'll bring the wine! 🙂
I'd love to have a listen. 🙂
I'll bring the wine! 🙂
After impressive 4826 posts, excuse me if I'm got lost: Any experience driving the array as 1.5-way (cutting high frequency at both ends of the array) ?
If I were running a finite array, I would try something like that (basically a form of shading). I'm trying to mimic an infinite array so; no would be the short answer.
I'm reading a lot on other threads that have my interest, like how the Synergies are doing and the subjective reviews they get, so I was reading the Monster Massive thread as one of my regulars...
Posts like these:
I experience a very solid center image, basically no trace that hint to the actual speakers with a mono source, so I can relate to these subjective reports very well.
But I would like to know more of what really brings that kind of magic to us...
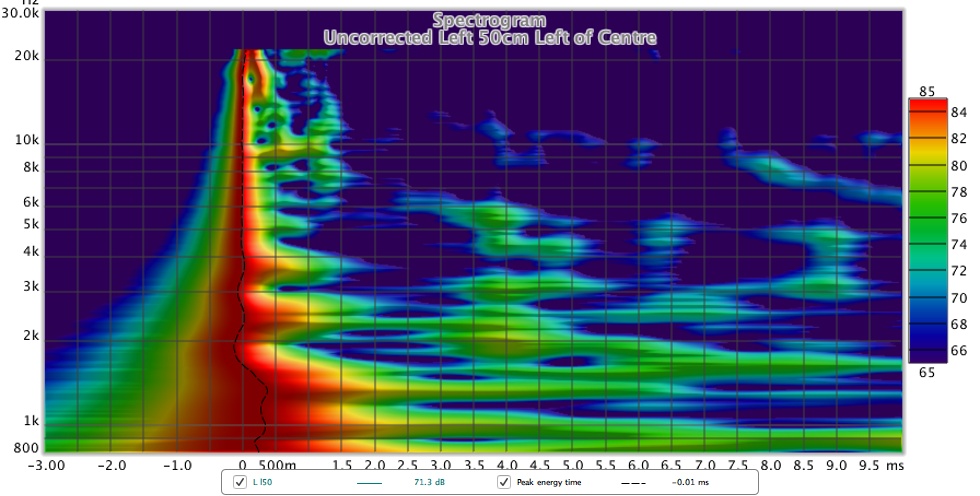
Just today a Spectogram of the Danley SH50 showed up:
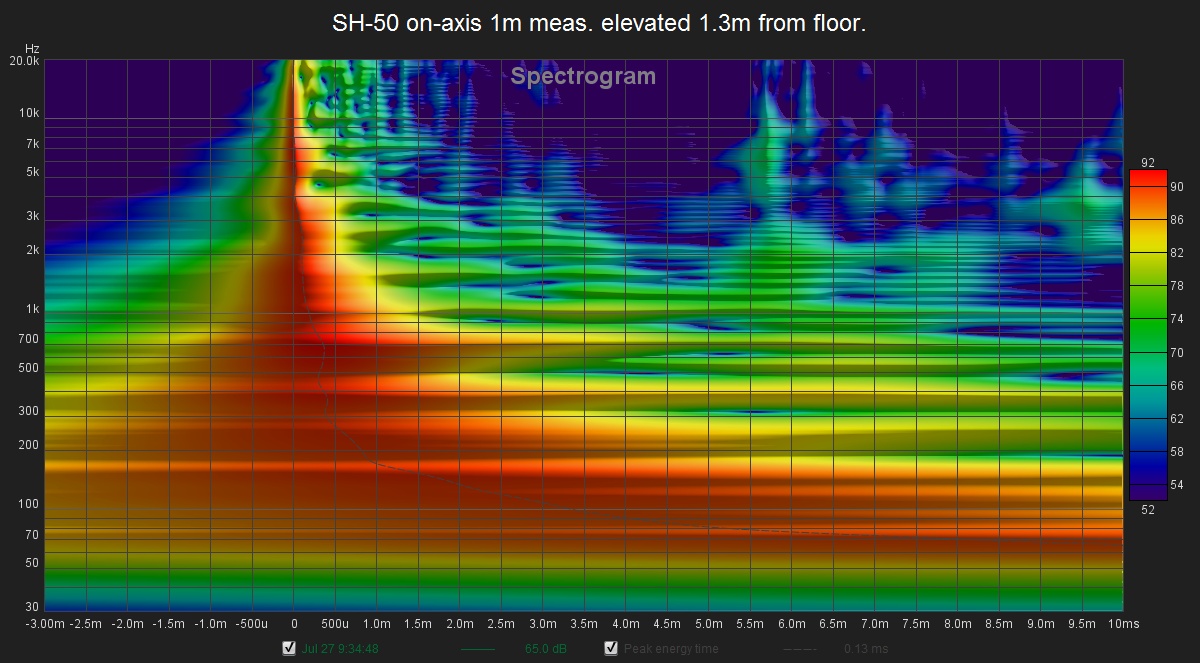
(source thread: Monster Massive)
So I went back into my own files and tried to mimic the specific settings as close as possible with a plot of my own arrays...

In contrast to the SH50 graph, this one is taken at the listening spot (at about 2.7 m) and with both speakers playing. But it's not that bad, is it? The horns will avoid more room, as can be seen, but that SH50 plot was taken at a closer distance anyway.
My bass output goes higher than the plot limit I've set, that's why it's a big red mess at the bottom, but I didn't want to use the "normalize to peak" feature.
It's fun to see this comparison to what I would call a reference speaker, even if it isn't telling us that much. If you look closely, you'll even see some pré ringing in my (FIR corrected) result(!).
This is just for fun, don't take it too seriously 🙂. Though it might explain just a little bit why I can relate to those posts when reading them?
Posts like these:
I've noticed that the 90degree synergies (CoSyne, SmallSyn, 3DP) all did that center image thing. What always amazes me is that I can sit there looking at each speaker and can't make myself perceive that the sound comes from the speaker itself. Unlike other speakers I've had, even the tall BG ribbons with their impressive imaging I could switch to hearing the sound as being from the sources without too much effort. Narrower horns (though they weren't Synergy) didn't seem to do it either, nor did the 90 degree Econowaves I played with. The common elements seem to be coaxials and directivity (and me being the listener, of course). Maybe those Tannoys fall in the same category.
Not sure if the wide directivity is involved, but I've tended toward wider horns because they seem less likely to sound like horns to me. I still have cringing memories of the KHorns I used to have (SpeakerLab clones of the Klipsch, not original) and their narrow midrange horns, those I'm pretty sure I could have been blindfolded and able to aim a laser pointer at each driver!
K-402 do this imaging across the middle as their trademark sound, including the K-402-MEH configuration, and the two-way Jubilee configuration crossed at about 400-550 Hz (based on order of the filters used with slightly higher xo frequencies used for lower order filters). The entire front wall becomes the apparent source of sound.
I find that the only limitation is speech intelligibility and locking in the center image if you're listening off-axis using stereo only. A three-across (L, C, R) configuration when dialed in properly is seamless and doesn't care where you sit or stand anywhere in the room, like at good commercial cinemas...
Chris
I experience a very solid center image, basically no trace that hint to the actual speakers with a mono source, so I can relate to these subjective reports very well.
But I would like to know more of what really brings that kind of magic to us...
Just today a Spectogram of the Danley SH50 showed up:
(source thread: Monster Massive)
So I went back into my own files and tried to mimic the specific settings as close as possible with a plot of my own arrays...
In contrast to the SH50 graph, this one is taken at the listening spot (at about 2.7 m) and with both speakers playing. But it's not that bad, is it? The horns will avoid more room, as can be seen, but that SH50 plot was taken at a closer distance anyway.
My bass output goes higher than the plot limit I've set, that's why it's a big red mess at the bottom, but I didn't want to use the "normalize to peak" feature.
It's fun to see this comparison to what I would call a reference speaker, even if it isn't telling us that much. If you look closely, you'll even see some pré ringing in my (FIR corrected) result(!).
This is just for fun, don't take it too seriously 🙂. Though it might explain just a little bit why I can relate to those posts when reading them?
Attachments

Say graphs were directly compareable i say ha ha are you crazy man, yours build up of pre verse post symetri is much more real uniform looking, then comes IIR XO delays is visible on SH50 and enviroment won't help here increase microphone distance to SH50, so can't see other than yours is excellent also because acoustic performance is out at listenening position and what should really help SH50 graphs if distance is increased. That said what illusions build up in our own heads about say 3d/center image/depth/ratio of recording signature verse ratio of own room signature/senced sum of resolution etc and etc can probably be hard interpret in graphs, but yours is really much more than not bad 😀...
Last edited:
So I went back into my own files and tried to mimic the specific settings as close as possible with a plot of my own arrays...
In contrast to the SH50 graph, this one is taken at the listening spot (at about 2.7 m) and with both speakers playing. But it's not that bad, is it? The horns will avoid more room, as can be seen, but that SH50 plot was taken at a closer distance anyway.
My bass output goes higher than the plot limit I've set, that's why it's a big red mess at the bottom, but I didn't want to use the "normalize to peak" feature.
It's fun to see this comparison to what I would call a reference speaker, even if it isn't telling us that much. If you look closely, you'll even see some pré ringing in my (FIR corrected) result(!).
This is just for fun, don't take it too seriously 🙂. Though it might explain just a little bit why I can relate to those posts when reading them?
Hi Wesayso,
Your spectrogram of course looks exemplary!
It looks unusually outstanding even for one speaker taken close up; the fact it is for a stereo pair taken at listening spot shows incredible tuning and work with room acoustics.
May I ask how much FIR your are using...#taps at what sample rate?
How low in frequency do you correct?
Would you show the applied mag and phase correction curves? That would give me a good picture of what to expect from a similar line-array I'm considering.
Any chance you have spectrograms away from the listening spot....say 1m off listening spot, horizontal and vertical?
The CBT guys say they can get square waves both on and off axis, which in my mind would be the identical result as your spectrogram holding up off axis.
(Deep into studying straight-line with delay vs CBT, as per the other thread.
This kind of info really helps 🙂)
Quite a few questions there, Mark 🙂.
Let me see if I can answer a few of them.
FIR filter is running at 44100 sampling frequency, 32 bits. The number of tabs is 65536. Why? Because I can. I don't mind the delay for audio replay and audio/video sync for Home Theater is handled from within JRiver.
I correct from 20 to 20000 Hz with DRC FIR. Compensation is set to minimum phase but with a phase correction (excess phase) running below 500 Hz at about half the (sliding window) frequency dependent window length that is used for the frequency correction. I've even shared the correction templates and settings from DRC of one of my earlier correction schemes. It is linked somewhere in this thread. Things haven't changed that much ever since, aside from correcting based on an average of 9 measurements at 3 different measurement spots per speaker these days.
I've probably shown an example of the correction somewhere before too, as I found it uploaded to my web space...
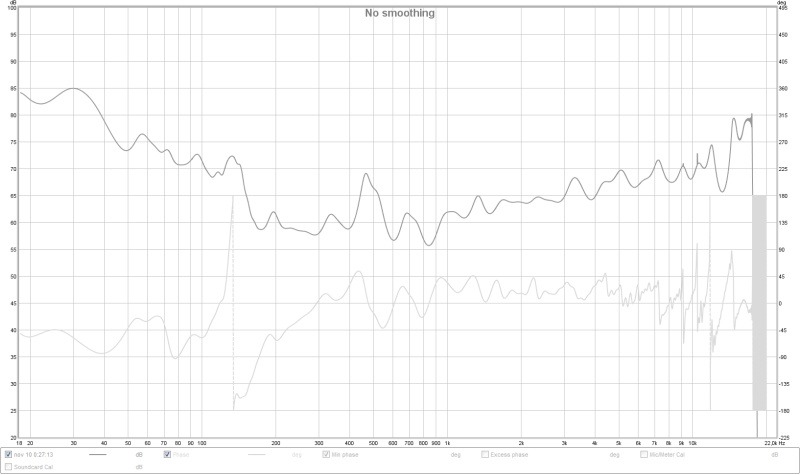
This correction has quite a huge phase swing, right about where the speaker is playing trough it's impedance peak. I first looked at all spots along the listening area to make sure it was happening at all seats before accepting this correction. I never found the exact reason for this, I've seen in in almost all array measurements from different builds, save for one, the corner array from ra7. So I guess it is room position but it holds up under all seats covering the listening area. It's frequency also corresponds somewhat with baffle length though 🙄. This is a spot where I expect to be able to do better with adding my subs.
This correction (which includes the pré EQ I use) above gets it's share of EQ on top of it though, do you see the small and narrow boost peaks at higher frequencies? That's basically the FIR correction battling comb filtering and it is softened by me with EQ.
The 3 measurement spot average I currently use already filters out the biggest peaks and dips that are very location bound, this was an older correction example.
I don't have any far off axis plots taken with correction in place, but I'll show it to you in another way:
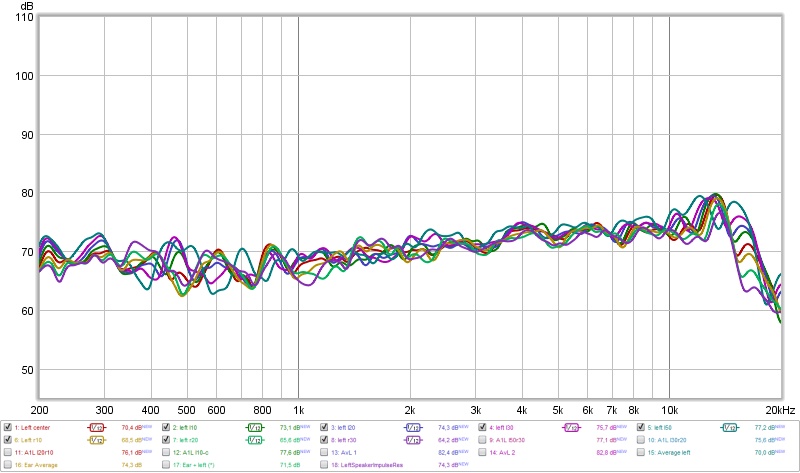
Above is a set of raw measurements of the left channel, taken with IIR pré EQ to combat the line effect on frequency output, getting it ready for FIR correction.
I've smoothed these with 1/12, usually I would show a 6 cycle frequency dependent window (as seeing that is way more important to me). This is a set of measurements spanning a meter from left to right of the left channel. The magnitude stays within plus/minus 2.5 dB overall except for the far right measurements of the left channel that fall beyond the reach of my damping panels. (damping panels are optimized to battle first reflections as seen from a sweet spot perspective)
So, yes, I can do square waves off axis as well. In all honestly, I think I've shown way more measurements (that matter) than the CBT crowd up to now. I think I've seen just one IR from one of those CBT's after nagging about it for a long long time. In that same period I've seen IR's from at least 6 different straight floor/ceiling line arrays as I've lend a hand here and there helping others get their feet wet with processing. (and quite a few other speakers as well)
Even Keele doesn't really show that much. At least nothing that proves any phase coherency to me.
Go to ra7's thread for even more disclosure, also Halair's thread, as both used to have measurements up for download. That's the one thing I didn't do. I do have my reasons.
In your specific quest, running arrays in a non treated environment I do believe you would be best served with a physically bent CBT array. That one would be less prone to react to parallel planes. Making it virtually bent with DSP does not act similar and i bet you'll get some problem frequencies due to nearby walls. As you would with straight arrays as well, without any treatment. It probably would still sound just fine though. Not everyone with a straight array went as far as me with damping reflections.
Hope this post helps you...
P.S. nothing new here, as I've shared it all before, perhaps not all on this thread. But I hope it answers your curiosity. Now please get me to a place of similar disclosure about CBT arrays. Especially about those square waves. Not to dis them, just to satisfy my curiosity. If we all share more, we will all learn more, and get better at it. You don't know how glad I was to see that SH50 plot! That's the stuff I want to see! IR's and Spectograms and waterfall plots... Room interaction at the listening spot. Basically all that I've shown in this thread. I want to learn what brings us the magic and joy, from whatever speaker/room combo that works!
Let me see if I can answer a few of them.
FIR filter is running at 44100 sampling frequency, 32 bits. The number of tabs is 65536. Why? Because I can. I don't mind the delay for audio replay and audio/video sync for Home Theater is handled from within JRiver.
I correct from 20 to 20000 Hz with DRC FIR. Compensation is set to minimum phase but with a phase correction (excess phase) running below 500 Hz at about half the (sliding window) frequency dependent window length that is used for the frequency correction. I've even shared the correction templates and settings from DRC of one of my earlier correction schemes. It is linked somewhere in this thread. Things haven't changed that much ever since, aside from correcting based on an average of 9 measurements at 3 different measurement spots per speaker these days.
I've probably shown an example of the correction somewhere before too, as I found it uploaded to my web space...
This correction has quite a huge phase swing, right about where the speaker is playing trough it's impedance peak. I first looked at all spots along the listening area to make sure it was happening at all seats before accepting this correction. I never found the exact reason for this, I've seen in in almost all array measurements from different builds, save for one, the corner array from ra7. So I guess it is room position but it holds up under all seats covering the listening area. It's frequency also corresponds somewhat with baffle length though 🙄. This is a spot where I expect to be able to do better with adding my subs.
This correction (which includes the pré EQ I use) above gets it's share of EQ on top of it though, do you see the small and narrow boost peaks at higher frequencies? That's basically the FIR correction battling comb filtering and it is softened by me with EQ.
The 3 measurement spot average I currently use already filters out the biggest peaks and dips that are very location bound, this was an older correction example.
I don't have any far off axis plots taken with correction in place, but I'll show it to you in another way:
Above is a set of raw measurements of the left channel, taken with IIR pré EQ to combat the line effect on frequency output, getting it ready for FIR correction.
I've smoothed these with 1/12, usually I would show a 6 cycle frequency dependent window (as seeing that is way more important to me). This is a set of measurements spanning a meter from left to right of the left channel. The magnitude stays within plus/minus 2.5 dB overall except for the far right measurements of the left channel that fall beyond the reach of my damping panels. (damping panels are optimized to battle first reflections as seen from a sweet spot perspective)
So, yes, I can do square waves off axis as well. In all honestly, I think I've shown way more measurements (that matter) than the CBT crowd up to now. I think I've seen just one IR from one of those CBT's after nagging about it for a long long time. In that same period I've seen IR's from at least 6 different straight floor/ceiling line arrays as I've lend a hand here and there helping others get their feet wet with processing. (and quite a few other speakers as well)
Even Keele doesn't really show that much. At least nothing that proves any phase coherency to me.
Go to ra7's thread for even more disclosure, also Halair's thread, as both used to have measurements up for download. That's the one thing I didn't do. I do have my reasons.
In your specific quest, running arrays in a non treated environment I do believe you would be best served with a physically bent CBT array. That one would be less prone to react to parallel planes. Making it virtually bent with DSP does not act similar and i bet you'll get some problem frequencies due to nearby walls. As you would with straight arrays as well, without any treatment. It probably would still sound just fine though. Not everyone with a straight array went as far as me with damping reflections.
Hope this post helps you...
P.S. nothing new here, as I've shared it all before, perhaps not all on this thread. But I hope it answers your curiosity. Now please get me to a place of similar disclosure about CBT arrays. Especially about those square waves. Not to dis them, just to satisfy my curiosity. If we all share more, we will all learn more, and get better at it. You don't know how glad I was to see that SH50 plot! That's the stuff I want to see! IR's and Spectograms and waterfall plots... Room interaction at the listening spot. Basically all that I've shown in this thread. I want to learn what brings us the magic and joy, from whatever speaker/room combo that works!
Attachments
Last edited:
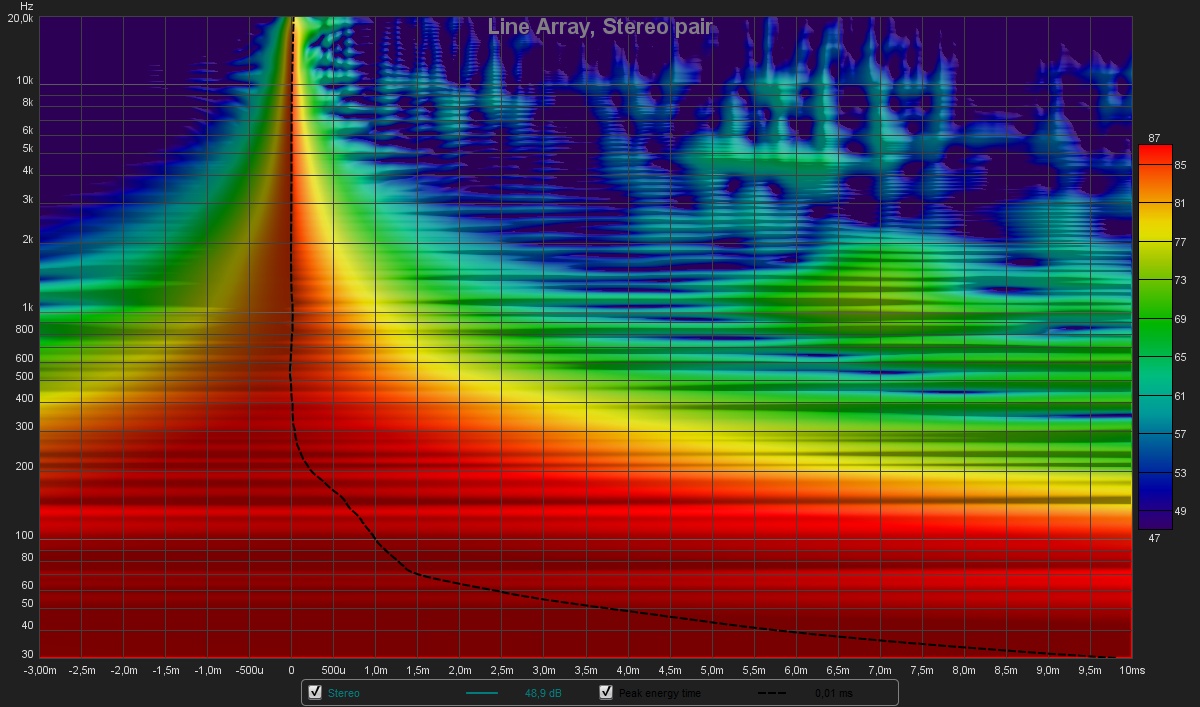
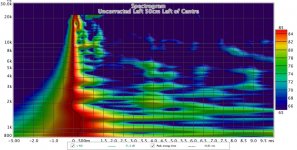
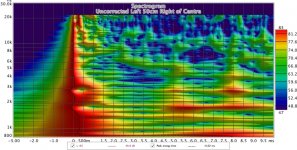
I hope wesayso doesn't mind, here are two spectrograms of my arrays, unprocessed at listening distance taken in a totally untreated room spanning the distance of approximately 1m across the couch with the left speaker above 800 Hz as below that the room takes over and destroys it! Most of the processing used to correct this is frequency based as the speaker is better than most from a time perspective.
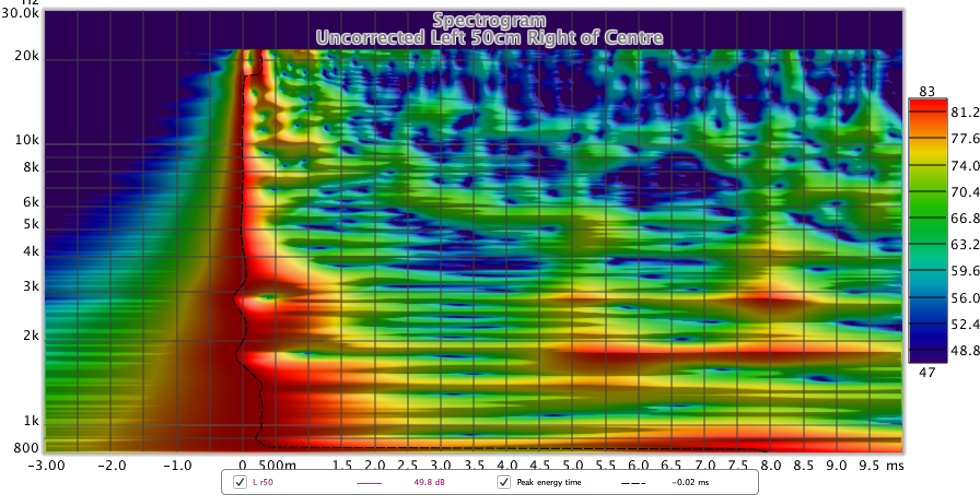
There is very little difference vertically due to the array behaviour and lack of crossovers, not worth putting the effort into measuring. In my first round of measurements I used a lot of different positions, I didn't bother with nearly so many on the second time round as this sort of speaker is really very consistent within a realistic domestic listening space.
There is very little difference vertically due to the array behaviour and lack of crossovers, not worth putting the effort into measuring. In my first round of measurements I used a lot of different positions, I didn't bother with nearly so many on the second time round as this sort of speaker is really very consistent within a realistic domestic listening space.
Attachments
Quite a few questions there, Mark 🙂.
Hope this post helps you...
P.S. nothing new here, as I've shared it all before, perhaps not all on this thread. But I hope it answers your curiosity. Now please get me to a place of similar disclosure about CBT arrays. Especially about those square waves. Not to dis them, just to satisfy my curiosity. If we all share more, we will all learn more, and get better at it. You don't know how glad I was to see that SH50 plot! That's the stuff I want to see! IR's and Spectograms and waterfall plots... Room interaction at the listening spot. Basically all that I've shown in this thread. I want to learn what brings us the magic and joy, from whatever speaker/room combo that works!
Thank you very much Wesayso, and i apologize for asking so many questions.
I kinda expected you to link me to the info in prior posts you've made.
I was being a little lazy because this great 'two towers' thread can make for daunting searches !
Instead you took the time here, to delve even deeper...thanks again.
The post and links have definitely helped...
I'm still probably on the path to a straight line that I can steer.
Keele's paper on implementing delay on straight lines to mimic CBT makes it look possible..or at least fun to play with. https://keele-omholt-technologies.c...oudspeaker-Arrays-Using-Signal-Delays-1-1.pdf
Plus, I wanna play with the line outside too 😀
And yes, I'd really love to see the kind of measurements/disclosure that you, Ra7, and some others provide. It would help us all in the kind ways you mention! Measurements really give credence to claims of sonic virtue, eh 😉
My own preference for seeing others' measurements, in a way I could fully follow would be..
to first see room-free raw speaker measurements,
then room-free corrected speaker measurements,
then corrected speakers in room untreated acoustically,
then corrected speakers in room treated acoustically.
Wishful thinking to the max, huh????? 🙂
Hey, just spit-balling on your phase swing at impedance peak.....
I've found phase can wrap like that when too much magnitude change occurs quickly, and then mag continues to change in the same direction.
The rate of boost between approx 150 and 180Hz is pretty steep, and then boost continues overall the rest of the way lower in freq.
In contrast, the sharp mag change at around 470Hz is just a spike that doesn't continue a mag trend, so there's no time for a phase wrap to generate.
I think the overall degrees of phase wrap comes from the natural LF rolloff of the driver...but the wrap will concentrate the phase change in the range where the steepest mag correction is applied (150-180Hz).
Make sense? Again just speculating, but I've seen that kind of phase jump when I try to boost low end. It might me worth a try to see if smoothing the applied mag correction there helps...
I always find it enlightening to see how the mag curve often looks like and inverse mirror of the phase curve.
Yes it does make sense and that's why I suspect improvement once the subwoofer will enter the picture, making me need less boost. I'll still run the lines full range, but I'll try and balance the left and right speakers with the left and right subwoofer.
Right now the left array is helping the right one (where the right one does not do the bottom end around 30 Hz as easy) and the right array helps to overcome the left 'nul', where there's a corner issue around 60 Hz. Together they sum real well and coherent in time (as a bandpass system).
I actually lower the amount of energy at the dip, and boost the opposite side accordingly. Only doable below 80 Hz and preferably even lower than that or not needed at all. Here's to hoping the subs can help with that (and help create a healthy dose of headroom).
Lucky for you a few of us line array nuts have taken their system outdoors for some measurements (for you to study). That wasn't in the cards for me.
Last edited:
well I was hoping Mark would go curved CBT as that is where I seem to be heading. I would certainly choose CBT over floor to ceiling straight line for portability and I don't see a need for steering in a home setting, just have to pick a good arc angle initially.
I would advise modelling whatever line in Vituix. It can show vertical polar maps so you can evaluate weighting and steering schemes based initially on driver piston diameter and traced data sheet FR. Kimmosto claims it not accurate, at least not accurate enough to eliminate the need for measurements but its at least a good general idea of how array will perform. He suggested measuring single driver polars and using those in Vituix to predict array performance, ostensibly accurately.
Mark: I couldn't find much info about the Q-Sys system. I'm looking at Motu and a PC instead for 8 channels so far...
well I was hoping Mark would go curved CBT as that is where I seem to be heading. I would certainly choose CBT over floor to ceiling straight line for portability and I don't see a need for steering in a home setting, just have to pick a good arc angle initially.
I would advise modelling whatever line in Vituix. It can show vertical polar maps so you can evaluate weighting and steering schemes based initially on driver piston diameter and traced data sheet FR. Kimmosto claims it not accurate, at least not accurate enough to eliminate the need for measurements but its at least a good general idea of how array will perform. He suggested measuring single driver polars and using those in Vituix to predict array performance, ostensibly accurately.
Mark: I couldn't find much info about the Q-Sys system. I'm looking at Motu and a PC instead for 8 channels so far...
Hi nc535, I'm going to reply on my steering thread to not spin off on wesayso's, ok?
- Home
- Loudspeakers
- Full Range
- The making of: The Two Towers (a 25 driver Full Range line array)