Brytt,
Are you really looking at implementing a slope with a -8db at 10Khz from the 20hz level? Just seems a bit excessive that much slope?
Are you really looking at implementing a slope with a -8db at 10Khz from the 20hz level? Just seems a bit excessive that much slope?
Know there's a chance it can be comb non repairable same distances to somewhere, but there was nothing else to do other than try in first place because i haven't got their measurement gear to recheck, but in it sound pretty good also confirmed by others will let it be, by the way over time got the experience that IIR aggressive EQ can work fine as long as its pretty precise reverse.
When we input only a left or only a right signal we get an average between the mid and side EQ.
A bit too quick here. The side content isn't the average of the mid and L_R result.
The side is the average of the L-R and half of the mid curve. 😱
Which means if we want to offset a dip in the mid curve we only need to use half of that dip's value. That is if we start with the side curve as a standard target.

Last edited:
I hope I won't bore you guys with this (I hope not), another mid/side graph.
(again, this is based on virtual tests by running (listening position) measured IR's trough the processing chain and record to disk)
I'm having too much fun with this though, so I'll just post away. Who knows, it might inspire others...
Based on the results of the previous graph, a page ago, I've made some tweaks to the ~2 kHz area. However that last graph I showed was based on a 6 cycle frequency dependent window view of the resulting output. As JBL's preferred room curve graphs were originally meant to represent a 'steady state room curve' I figured I might have to change my graphs to reflect the complete un-gated 500 ms measurement window, with 1/3 octave smoothing applied:

All curves un-gated and smoothed with 1/3 octave
The processing was done a little different too. As said: the mid/side processing should be the first thing in the chain. Else the difference between the left and right sides might skew the plots too much. However as I do have a good similarity between the left and right side after processing I temporarily moved the mid/side chain to the bottom after all processing. This way I did not need to re-EQ any of the graphs. It seems this works pretty good (good enough) to get the comparison I wanted to see.
Yellow is the sum of both channels when fed with a measured L-R signal and inverting the right channel before summing in REW.
Blue is the sum of both channels after feeding each a left or right channel only. (the pure 'side' part of mid/side processing)
The greenish graph is the sum of both channels feeding them the standard measured signal (representing L+R). (the 'phantom center' or 'mid' part of mid/side processing)
JBL curve overlaid again as the reference to the steady state curve.
I hope it (still) is of interest to some of you 🙂. After listening to this curve all week I think it's save to say the JBL trained listeners curve still translates very well for my taste. I didn't put in the work to get them to fit 100%, that could be a next test? So far I'm pretty satisfied with what I hear, playing with balance between mid and side, but also mains and ambient to see if I can pin down what does what for my perception. Still aiming for MyFi 😀. (aiming to please myself)
Seeing the outcome of the 6 cycle FDW compared to the un-gated 1/3 smoothed curves is very gratifying for me, personally. Suggesting the room adds very little in the way of coloration to the sound. Be assured, there are differences between the 6 cycle and smoothed curves, however the overall result (graph) still follows the same shape. I couldn't have done that without the damping panels.
I've redone that FDW graph as well, as the previous graph I showed did need a bit of EQ to look right:

All curves based on a 6 cycle Frequency Dependent Window
Close inspection of both graphs does reveal where the room alters the balance somewhat. The un-gated result seems to be even closer to the JBL curve and might explain my previous preferences, as far as the 6 cycle EQ target goes. As said before I arrived at a curve very close to this one based on listening and EQ (and repeat for weeks, or even months on end).
After my previous loss of EQ data, which had me do (almost) everything all over again I'm looking for things to aim for/hold on to. Always listening to the results (over several days) to determine if it's worth keeping. So far this seems to be one of those things to keep. 🙂 This is the best target I have tried without a doubt. Believe me, I've tried many! Named and un-named...
(again, this is based on virtual tests by running (listening position) measured IR's trough the processing chain and record to disk)
I'm having too much fun with this though, so I'll just post away. Who knows, it might inspire others...
Based on the results of the previous graph, a page ago, I've made some tweaks to the ~2 kHz area. However that last graph I showed was based on a 6 cycle frequency dependent window view of the resulting output. As JBL's preferred room curve graphs were originally meant to represent a 'steady state room curve' I figured I might have to change my graphs to reflect the complete un-gated 500 ms measurement window, with 1/3 octave smoothing applied:
All curves un-gated and smoothed with 1/3 octave
The processing was done a little different too. As said: the mid/side processing should be the first thing in the chain. Else the difference between the left and right sides might skew the plots too much. However as I do have a good similarity between the left and right side after processing I temporarily moved the mid/side chain to the bottom after all processing. This way I did not need to re-EQ any of the graphs. It seems this works pretty good (good enough) to get the comparison I wanted to see.
Yellow is the sum of both channels when fed with a measured L-R signal and inverting the right channel before summing in REW.
Blue is the sum of both channels after feeding each a left or right channel only. (the pure 'side' part of mid/side processing)
The greenish graph is the sum of both channels feeding them the standard measured signal (representing L+R). (the 'phantom center' or 'mid' part of mid/side processing)
JBL curve overlaid again as the reference to the steady state curve.
I hope it (still) is of interest to some of you 🙂. After listening to this curve all week I think it's save to say the JBL trained listeners curve still translates very well for my taste. I didn't put in the work to get them to fit 100%, that could be a next test? So far I'm pretty satisfied with what I hear, playing with balance between mid and side, but also mains and ambient to see if I can pin down what does what for my perception. Still aiming for MyFi 😀. (aiming to please myself)
Seeing the outcome of the 6 cycle FDW compared to the un-gated 1/3 smoothed curves is very gratifying for me, personally. Suggesting the room adds very little in the way of coloration to the sound. Be assured, there are differences between the 6 cycle and smoothed curves, however the overall result (graph) still follows the same shape. I couldn't have done that without the damping panels.
I've redone that FDW graph as well, as the previous graph I showed did need a bit of EQ to look right:
All curves based on a 6 cycle Frequency Dependent Window
Close inspection of both graphs does reveal where the room alters the balance somewhat. The un-gated result seems to be even closer to the JBL curve and might explain my previous preferences, as far as the 6 cycle EQ target goes. As said before I arrived at a curve very close to this one based on listening and EQ (and repeat for weeks, or even months on end).
After my previous loss of EQ data, which had me do (almost) everything all over again I'm looking for things to aim for/hold on to. Always listening to the results (over several days) to determine if it's worth keeping. So far this seems to be one of those things to keep. 🙂 This is the best target I have tried without a doubt. Believe me, I've tried many! Named and un-named...
Last edited:
Just a "view behind the scenes" to show how often I do weird tests like these 😀
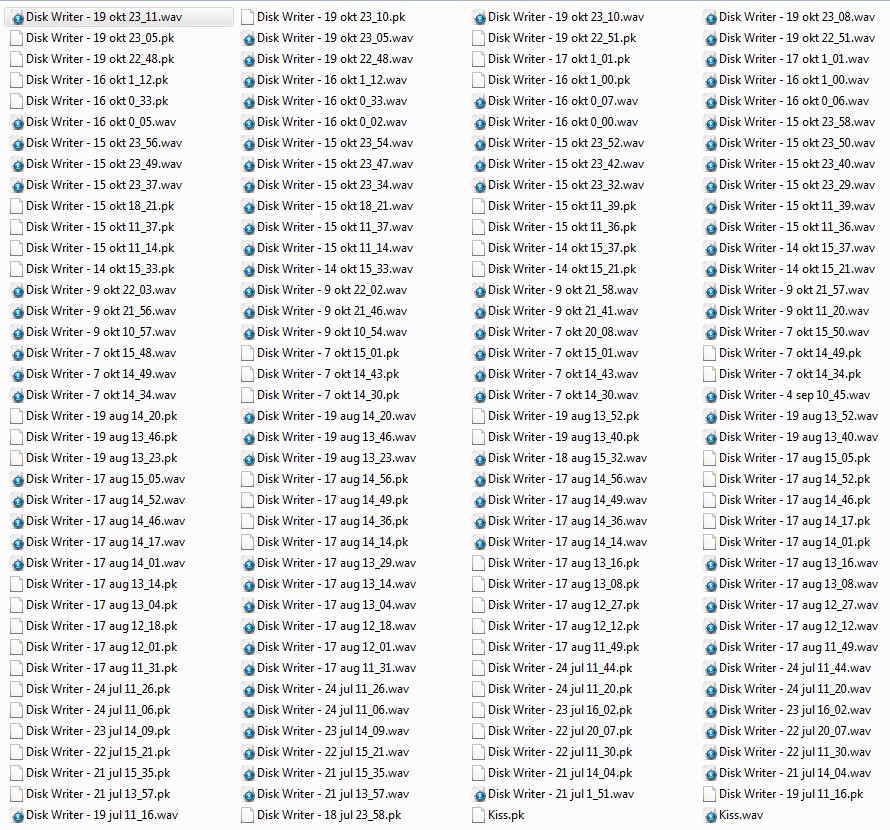
This is the folder on my disk containing the virtual tests as recorded by JRiver. I have many many more folders with subsequent tests saved on my hard disk in other folders. I run many of these virtual tests to figure stuff out. Lots easier to do than full blown measurements, though one does not escape from checking the results every once in a while in a real world measurement.
(every *.pk is from a wav file that was edited in CoolAudio, some of the original wav files were either moved or deleted)
Another fun detail, that "Kiss.wav" file is the original file I shared long ago (should still be online) giving you guys an impression of the listening position.
I never moved or deleted it. It dates back to September 2015. Should still be hidden somewhere in this huge thread.
Attachments
Last edited:
Yellow is the sum of both channels when fed with a measured L-R signal and inverting the right channel before summing in REW.
Blue is the sum of both channels after feeding each a left or right channel only. (the pure 'side' part of mid/side processing)
The greenish graph is the sum of both channels feeding them the standard measured signal (representing L+R). (the 'phantom center' or 'mid' part of mid/side processing)
I knew it was boring 😉
Just to clarify, the yellow graph is the side target of the mid/side EQ, the green graph the mid part. Target is the blue graph, that is the resulting "real life" side curve.
The way I have the mid/side EQ configured is still a bit entangled but largely reflecting the description of setting the blue target as a house curve and deviate to both sides with the mid/side EQ. Not entirely similar anymore to the numbers posted in fluid's thread, but close.
Do you know what the changes would be if you were to apply it as a separate process like I have?Not entirely similar anymore to the numbers posted in fluid's thread, but close.
That remains a valid, but difficult to answer question 😀.
It would largely depend on the target curve used. As the numbers I gave you were based on another experiment I did (using measurement averages) I tried to get the settings out of my mixed target/mid-side EQ the best I could.
It would be easier to set the target to the JBL preferred listeners curve and deviate from that for both mid and sides. That's 'almost' what I have now.
Look at the yellow lines, they are close but not entirely following the 1 dB/octave downwards drop. It's dropping a bit faster above 1-2 kHz. I also added a bump at 3.7 kHz, dip at 5500 and bump at 7200 to that curve to get the measured side closer to the JBL curve.
If I were a smart person, I'd trace the JBL curve (like BYRTT would do) and use that as the standard target. Though due to my loss of some previous data I'm still using an older FIR correction that was manipulated with RePhase as my base correction. I lost the Rephase settings for that one and haven't figured out how to redo it yet.
Let me list all settings I have in my mid/side EQ, it may help to trace back what I did.
Mid EQ:
Frequency 1550 Q 1.30 gain 1.5
Frequency 3700 Q 2.7 gain -2.5
Frequency 7200 Q 3.0 gain -1.5
Frequency 5500 Q 4.0 gain 1.0
Frequency 600 Q 0.5 gain -2.3
Frequency 3000 Q 3.5 gain -1.5
Frequency 100 Q 0.5 gain 0.5
High Shelf 4500 Q 0.71 gain 0.5
Side EQ:
Frequency 600 Q 0.5 gain 1.2
Frequency 5400 Q 2.75 gain -0.6
Frequency 3700 Q 2.5 gain 0.4
Frequency 7400 Q 3.0 gain 0.4
High Shelf 1036 Q 0.71 gain -0.6
Low Shelf 80 Q 0.7 gain -0.6
High Shelf 2413 Q 0.71 gain 0.5
The biggest difference of my original target (compared to JBL) will be around 1-2 kHz. The rest of it should be largely symmetrical. These numbers do not include the gradual drop above ~1 kHz as seen in the JBL target curve.
Disclaimer: ask me again in a day and I will probably have altered a few numbers again, but they will remain close to these.
Last edited:
If I have learned anything from this, it's to keep looking at 1/3 octave plots to figure out my perceived tonal balance. I'd use those plots to make any decisions about values etc. I actually edit the balance between left and right based on those plots, still striving for the same balance in FDW targets, with tweaks based on the 1/3 octave non gated plots. Within the Haas limit we still perceive later energy as being from that same source. They are extremely similar, but not the same.
Even my ambient signal can mess with perceived balance below 2/3 kHz. (yes, there are mid/side tweaks in that one as well (lol))
Even my ambient signal can mess with perceived balance below 2/3 kHz. (yes, there are mid/side tweaks in that one as well (lol))
I tried a closer resemblance to the JBL curve. I'll show the graphs a little later.
It didn't do it for me. Main differences were between 100 and 2 kHz.
I guess I like a little more "brown sound" as Eddie Van Halen used to call it...
It just creates more synergy for me, a touch of warmth. These are small differences though.
Over a large enough frequency spectrum it does matter! At least for me it does 😉.
As promised, the graph that closer resembles the JBL steady state curve for the actual side balance:

However, this one didn't do it for me. Even though the changes are minimal at best, the perceptual differences were there. Clean and open sounding, but less captivating.
Missing a touch of warmth on the bottom 200-400 end... As I've said before I am a sucker for that type of warmth. Can't hardly be more of a difference than a sloped 1 dB between 200-1 kHz.
Lesson from this: listen to it, play with it, keep what you like!
Thumb up fantastic studies and work loads done there.
Come to think about your system probably should have its own objective deviations from that JBL science curve, reason is they probably used multi way speakers including minimum phase XO points that add phase lag to direct wave-front and power response distortion into XO points transition areas, where yours is very different in these fields and actual brought to via accepted overall small system delay in DSP perform a impressive perfect minimum phase system domain at listening position including room. From own subjective experience so far sense they need a bit hotter amplitude at lowest octaves to kind of mask what low minimum phase XO points add to timing and it was especially obvious when had that Beolab 90 demo in past, yours as set of December 2016 was sensed less hot down there but much more as real world will sound in for example remember kick drum for live track Hotel California was fantastic better on yours system bringing higher harmonics in sync with the low end real kick time. When saying they kind of mask i mean that boosting very lows in minimum phase domain will help speed up phase timing lag that summing XO point was responsible of and hotter direct wave front probably help mask later lower level room interference. Hope input can help a bit and is not all nonsense, its based own experience subjective verse objective data so far having power of magical DSP engines available to do exercises.
Come to think about your system probably should have its own objective deviations from that JBL science curve, reason is they probably used multi way speakers including minimum phase XO points that add phase lag to direct wave-front and power response distortion into XO points transition areas, where yours is very different in these fields and actual brought to via accepted overall small system delay in DSP perform a impressive perfect minimum phase system domain at listening position including room. From own subjective experience so far sense they need a bit hotter amplitude at lowest octaves to kind of mask what low minimum phase XO points add to timing and it was especially obvious when had that Beolab 90 demo in past, yours as set of December 2016 was sensed less hot down there but much more as real world will sound in for example remember kick drum for live track Hotel California was fantastic better on yours system bringing higher harmonics in sync with the low end real kick time. When saying they kind of mask i mean that boosting very lows in minimum phase domain will help speed up phase timing lag that summing XO point was responsible of and hotter direct wave front probably help mask later lower level room interference. Hope input can help a bit and is not all nonsense, its based own experience subjective verse objective data so far having power of magical DSP engines available to do exercises.
Last edited:
Thanks BYRTT.
You do make some good points, but I don't have the answer here. My guess is I like what I like due to room gains in certain frequency area's. Meaning what works for me in my room might not necessarily translate to another room 1 on 1. However I'm still quite close to the Harmon graph and see it as a good base curve to aim for. At least for a reasonably behaved listening environment.
A higher level of bass energy could mask certain aspects of the frequencies above it but at the same time be very entertaining. Can it sound more convincing trough hiding the time distortion caused by crossovers? That's a tough one, the differences often are subtle...(less subtle if the bass is early 😉) I still think the harmonics lining up helps to get a sweet, full bodied and convincing sound.
In comparison the frequency curve itself plays a huge roll in our perception when compared to time coherency.
Even slight adjustments in a house curve can make quite a difference. One of the things I listen for: does it make me adjust to the (scenery in the) song quicker? Do I adapt to the space as presented by the wave front? Our brain helps us identify the room we are in, usually without too much thinking. However I absorbed (first reflection points) or even drown out parts of my real room queues (ambient channels) for those present in the music I play back. If it works it can be quite convincing. If not I'll notice my head keeps puzzling. If the music works to relax me, 'take in the scenery' so to speak I do notice that feeling while listening.
After examining my room over these past years, even the room sound itself by playing back a recording of it (the room) over the same speakers, listening for room queues with more awareness wherever I go I try to get/gain a bigger understanding of what my brain (automatically) does. It's quite something, being as unaware of room coloration as we usually are. But we can train ourselves to be more aware of these queues. Not saying you should though, as it might even destroy some of your listening pleasure.
I did try it though, and I'm still able to enjoy the occasional table radio with the right song in a casual way. Or, for example, listening to my lowly TV speakers I can still be moved by a performance at times.
I do notice more awareness whenever I go sit on that couch in my living room and turn on my speakers. Managing to please myself there has been tough due to that. But not quite impossible!
If it wasn't fun for me I wouldn't still try to improve on it. I've learned a great deal (I think 🙂) and have become a different, more aware listener. It didn't spoil my music for me, in fact it has given me many magical moments and it even expanded my interest in musical genres. What's not to like? 😀
hi wesayso,
i am late to the party. i am building a small speaker in a similar way. i.e. using layers of wood panels to construct the enclosure. initially i thought of using threaded rods only to hold the panels until glue dries. now i want to know if rods can be used to tightly hold the panels and then glue may not be needed!
i am sorry i couldn't go through the entire thread. but can you tell me if you are glueing the panels or simply holding them together with threaded rods?
You must have skimmed the thread, that answer was on page one 🙂

http://www.diyaudio.com/forums/full-range/242171-towers-25-driver-range-line-array.html#post3624617
But I need to warn you about it, on page 11 something happened that made this thread quite popular 😱...

http://www.diyaudio.com/forums/full-range/242171-towers-25-driver-range-line-array-11.html#post3701938
(if I only think back on how much time I spend on getting a mirror finish on that PU coat...)

They were almost too slippery for a photograph to do them justice.
Wood will never stop expanding and contracting. I figured I could pressure the wood enough with the rods to stop that, while sealing it with a PU paint inside and out. I was wrong. And I wasn't the only one with this misfortune, it happened to people with smaller stacks than mine. So be aware of the choice you're going to make!
After a long period of going trough my options I came up with a solution.
To fix it, I hacked my stacks into smaller pieces...

and filled those cuts with expanding foam...

http://www.diyaudio.com/forums/full-range/242171-towers-25-driver-range-line-array-44.html#post4071561
After that I covered the whole stack with a fiberglass matt and epoxy:

And finished it with boat paint...

The rest is history... the recipe worked, they have survived after that. In the end, I did like the satin black/polished look even better than the wood + mirror finished PU coat that would have gotten black baffles.
Here's an idea for your construction, put multiple gaskets made of a flexible rubber between the layers...
http://www.diyaudio.com/forums/full-range/242171-towers-25-driver-range-line-array-23.html#post3721197
http://www.diyaudio.com/forums/full-range/242171-towers-25-driver-range-line-array.html#post3624617
But I need to warn you about it, on page 11 something happened that made this thread quite popular 😱...
http://www.diyaudio.com/forums/full-range/242171-towers-25-driver-range-line-array-11.html#post3701938
(if I only think back on how much time I spend on getting a mirror finish on that PU coat...)
They were almost too slippery for a photograph to do them justice.
Wood will never stop expanding and contracting. I figured I could pressure the wood enough with the rods to stop that, while sealing it with a PU paint inside and out. I was wrong. And I wasn't the only one with this misfortune, it happened to people with smaller stacks than mine. So be aware of the choice you're going to make!
After a long period of going trough my options I came up with a solution.
To fix it, I hacked my stacks into smaller pieces...
and filled those cuts with expanding foam...
http://www.diyaudio.com/forums/full-range/242171-towers-25-driver-range-line-array-44.html#post4071561
After that I covered the whole stack with a fiberglass matt and epoxy:
And finished it with boat paint...
The rest is history... the recipe worked, they have survived after that. In the end, I did like the satin black/polished look even better than the wood + mirror finished PU coat that would have gotten black baffles.
Here's an idea for your construction, put multiple gaskets made of a flexible rubber between the layers...
http://www.diyaudio.com/forums/full-range/242171-towers-25-driver-range-line-array-23.html#post3721197
that is cool wesayso
(i just realized that your handle is "we""say""so"....!)
however i am not going to build towers. just a bookshelf size speakers. and its not horizantally cut panels but vertical ones stacked side by side.
(i just realized that your handle is "we""say""so"....!)
however i am not going to build towers. just a bookshelf size speakers. and its not horizantally cut panels but vertical ones stacked side by side.
Hahaha, yes, why? Becuzz We Say So 😉
At least you get to make an informed decision, but it will be up to you to make that call.
Not because I said so 😀
At least you get to make an informed decision, but it will be up to you to make that call.
Not because I said so 😀
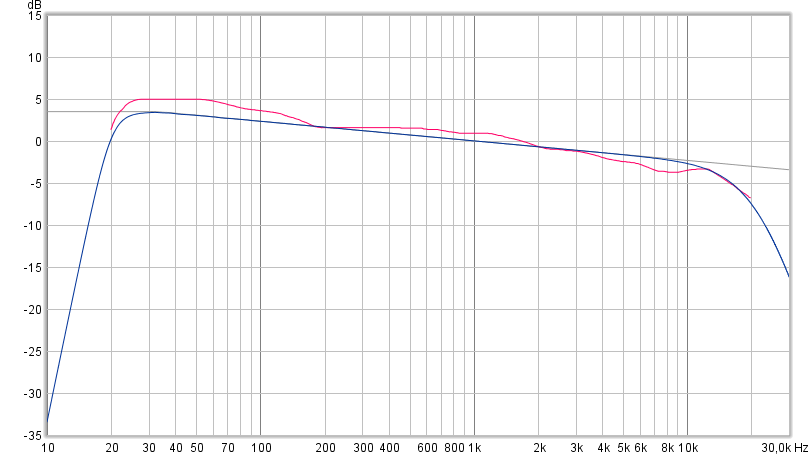
Had another look into that interesting preferred curve (red) from JBL study verse (grey) 7dB curve, think there is reason to think they have some similarities when reasonable stop bands are also added to 7dB curve which is at +3,5dB out to 30Hz point then strait declining line out to -3,5dB point at 30khz passing zero dB point at exactly 1kHz. High passed 7dB curve with a look alike of JBL study and low passed it dual 2nd order BW one at 20kHz say this is tweeter performance and one at 25kHz say this is microphone roll off and got below.
Attachments

That photo with the hand saw going thru the cabinets kills me. 😱
I remember when the cabs originally split, that was a tough blow. Good to see that they are remaining stable, even if you had to use scary methods to get there.
I remember when the cabs originally split, that was a tough blow. Good to see that they are remaining stable, even if you had to use scary methods to get there.
Those cabinets splitting just goes to show you the theory that plywood is superior for an enclosure like this is utter nonsense, the ply only has advantage in a single orthographic direction. I'd bet money you couldn't possibly hear the difference between the two methods and the mdf enclosure would be worlds easier to construct. Put one layer of glass/epoxy onto an mdf enclosure and I would say it would be much more stable than a few thousand layers of glued together sheets!
Still love your enclosures final look WeSaySo, just don't buy your original conclusions that drove your conclusions to build with that flawed method you used, it proved itself to you before you got out that hand saw!
ps.The only reason that ply is used in pro-audio speakers is the need for moving pro speakers from location to location and the fact that mdf will get damaged if dropped or mishandled and the actual final weight of the enclosures. MDF is heavy, hint higher mass, and a pain to move if it adds hundreds of pounds to an enclosure!
Last edited:
- Home
- Loudspeakers
- Full Range
- The making of: The Two Towers (a 25 driver Full Range line array)