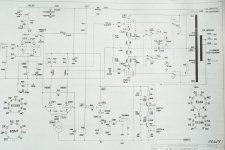
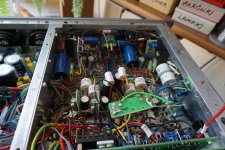
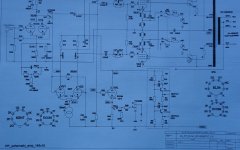
Please find enclosed updated schematics of the amplifier and PSUs. JarekCould you post you power supply schematic please. I would not expect this design to be unstable at 10Hz. If there's a problem in the amp it would be about 1Hz.
Attachments
I would check the 315V supply is in regulation. High voltage zeners have a poor temperature coefficient and the voltage goes up as they get hot. If you can see if there's any 10Hz on each supply. You can use a AC meter for this. Does it disappear if you remove the GNFB.
1N4744 is 15V zener, rather than 43V as displayed. R35 and C37 have a very low corner frequency. You may want to set up a step load test (both step down and step up using resistors and a switch) on the 315V supply and capture the voltage response waveform using a scope.


OK I will do square test with a XY plot for high frequencies for 10kHz .Jarek, what is the dB level of mid-band feedback being applied? With feedback applied, the LF phase shift is likely to be negligible until OPT roll off kicks in, which appears to be why your LF plots show little phase change given you only go down to 10Hz. I should have advised to do LF testing with feedback disconnected. I'd also suggest that an oscillator that goes down to 1Hz is needed to better appreciate what is happening, as well as to use a lower input signal so that LF resonance is not entered, and then the response may be easier to plot/identify.
The HF phase photos indicate that phase rises to 90 deg by 40kHz, but doesn't wander much away from 90 deg till after 100kHz. A squarewave response may be more enlightening of any dominate resonances that could influence stability.
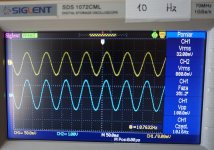
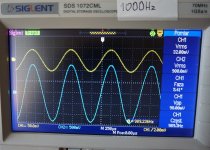
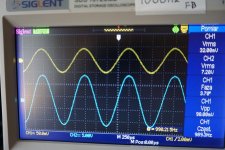
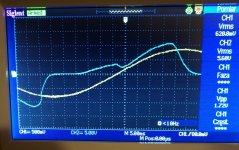
Enclosed two photos with response plot for 10kHz for regtangle and sinus (I notices LF jerks in time for sinus biased part of the plot).
Attachments

Squarewave testing is looking at the output voltage signal only. Some references:
https://www.dalmura.com.au/static/CareAndTreatment1957.pdf
https://frank.pocnet.net/other/AWV_Radiotronics/Radiotronics_1955/1955_06_AWV_Radiotronics_20_06.pdf
https://www.dalmura.com.au/static/Linear standard Radio News 1954.pdf
https://www.dalmura.com.au/static/CareAndTreatment1957.pdf
https://frank.pocnet.net/other/AWV_Radiotronics/Radiotronics_1955/1955_06_AWV_Radiotronics_20_06.pdf
https://www.dalmura.com.au/static/Linear standard Radio News 1954.pdf
1N4744 is 15V zener, rather than 43V as displayed. R35 and C37 have a very low corner frequency. You may want to set up a step load test (both step down and step up using resistors and a switch) on the 315V supply and capture the voltage response waveform using a scope.
I checked the Zener diode - this is 1N4755A and it is for 43V according to the catalogue. I understand the test shoud be done without real load of the amp and with let's say resistors ladder for 20-30-40mA?1N4744 is 15V zener, rather than 43V as displayed. R35 and C37 have a very low corner frequency. You may want to set up a step load test (both step down and step up using resistors and a switch) on the 315V supply and capture the voltage response waveform using a scope.
<trobbins
Jarek, what is the dB level of mid-band feedback being applied? With feedback applied, the LF phase shift is likely to be negligible until OPT roll off kicks in, which appears to be why your LF plots show little phase change given you only go down to 10Hz. I should have advised to do LF testing with feedback disconnected.>
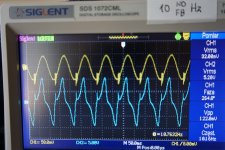
I enclose the photos of sinus/triangle plots done at low input singnal level at 10Hz/1000Hz and with/without NFB.
Jarek, what is the dB level of mid-band feedback being applied? With feedback applied, the LF phase shift is likely to be negligible until OPT roll off kicks in, which appears to be why your LF plots show little phase change given you only go down to 10Hz. I should have advised to do LF testing with feedback disconnected.>
I enclose the photos of sinus/triangle plots done at low input singnal level at 10Hz/1000Hz and with/without NFB.
Attachments
-
 10Hz-FB_regt_01_comp.jpg332.6 KB · Views: 99
 -
 10Hz-FB_sin_01_comp.jpg248.6 KB · Views: 95
 -
 10Hz-NOFB_reg_01_comp.jpg299.6 KB · Views: 93
 -
 10Hz-NOFB_sin_01_comp.jpg321.3 KB · Views: 96
 -
 1000Hz-FB_regt_01_comp.jpg242.4 KB · Views: 98
 -
 1000Hz-FB_sin_01_comp.jpg357.5 KB · Views: 90
 -
 1000Hz-NOFB_regt_02_comp.jpg298.2 KB · Views: 99
 -
 1000Hz-NOFB_sin_01_comp.jpg236.8 KB · Views: 106
 -
 Test in progress_01_comp.jpg336.5 KB · Views: 89
D37 is labelled 1N4744A, but also labelled 43V (which is an error).
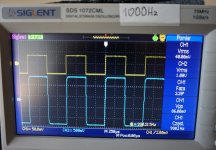
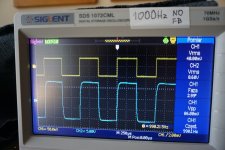
The 1kHz squarewave response shows no ringing, so I doubt you have any HF stability issue, although testing with no load and a few capacitances as load may show up some ringing, which would be appropriate to appreciate.
LF 10Hz response indicates you are over-driving the input for the 5V/div plots, and the OPT does not have enough inductance to support the applied drive voltage, which is why the output voltage collapses within about 20ms for the squarewave. I'd suggest you use the 1V/div LF plot drive level and do some X-Y plots with no feedback at say 10Hz, 20Hz, 50Hz to indicate the phase shift at LF.
Hello,D37 is labelled 1N4744A, but also labelled 43V (which is an error).
The 1kHz squarewave response shows no ringing, so I doubt you have any HF stability issue, although testing with no load and a few capacitances as load may show up some ringing, which would be appropriate to appreciate.
LF 10Hz response indicates you are over-driving the input for the 5V/div plots, and the OPT does not have enough inductance to support the applied drive voltage, which is why the output voltage collapses within about 20ms for the squarewave. I'd suggest you use the 1V/div LF plot drive level and do some X-Y plots with no feedback at say 10Hz, 20Hz, 50Hz to indicate the phase shift at LF.
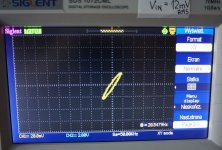
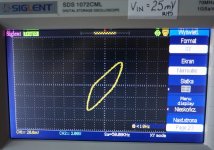
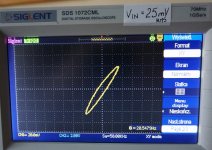
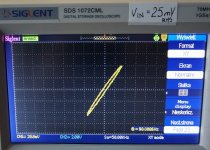
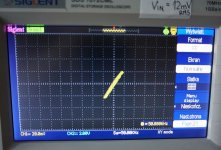
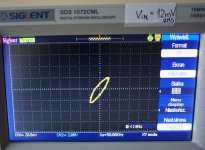
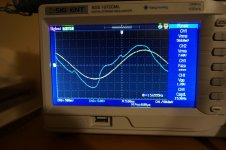
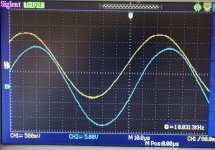
I will send you photos taken from the scope display for 10/20/50Hz and Vin=12mV/=25mV respectively. You can notice worse linearity for the bigger amplitude of the signal. The ellipse is becoming a quadrangle. Jarek
Attachments
Another experiment with C44=1uF full power, constant amplitude of input signal for 100/50/25/15/10Hz. See photos.D37 is labelled 1N4744A, but also labelled 43V (which is an error).
The 1kHz squarewave response shows no ringing, so I doubt you have any HF stability issue, although testing with no load and a few capacitances as load may show up some ringing, which would be appropriate to appreciate.
LF 10Hz response indicates you are over-driving the input for the 5V/div plots, and the OPT does not have enough inductance to support the applied drive voltage, which is why the output voltage collapses within about 20ms for the squarewave. I'd suggest you use the 1V/div LF plot drive level and do some X-Y plots with no feedback at say 10Hz, 20Hz, 50Hz to indicate the phase shift at LF.
I also tried replacement of Chokes (10H, 57R) into resistors R=390R 10W in the plate SU. No resonance but of cource output power is less 21W against 29W.
Attachments

Last edited:
Testing for HF stability aims to look for ringing response on the top of a squarewave, so testing with no-load and capacitive load is done with a squarewave (at circa 1-10kHz) and FB connected.
Testing for LF stability aims to identify increasing phase shift as frequency is reduced towards any LF resonance frequency, so testing is done with X-Y plots to identify phase shift (typically trying to identify when 90 deg is met) without F/B connected but with rated load resistance and signal low enough not to cause inductance limited operation.
Testing for LF stability aims to identify increasing phase shift as frequency is reduced towards any LF resonance frequency, so testing is done with X-Y plots to identify phase shift (typically trying to identify when 90 deg is met) without F/B connected but with rated load resistance and signal low enough not to cause inductance limited operation.
I enclose the photos of current schematic with changes and voltage measurements.
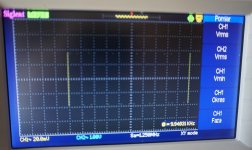
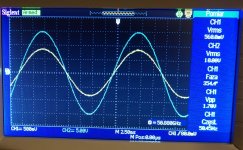
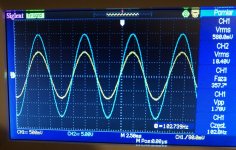
I enclose the photo of the scope display with sinus 10Hz. Plot is constant without 1Hz resonances. I also tested the amp with shelve filter - plots for 10Hz with no 1Hz resonanse present. I 'm not convinced to use them as the amp is stabile without them.
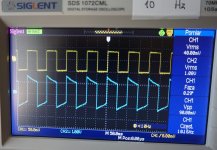
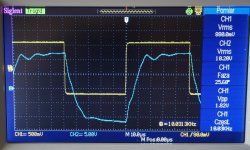
The third photo is done at 10kHz with regtangle HF ringing is still present.
I enclose the photo of the scope display with sinus 10Hz. Plot is constant without 1Hz resonances. I also tested the amp with shelve filter - plots for 10Hz with no 1Hz resonanse present. I 'm not convinced to use them as the amp is stabile without them.
The third photo is done at 10kHz with regtangle HF ringing is still present.
Attachments
You used a T - Filter for the feedback network?
I will let someone other than me comment on the viability of that.
I will let someone other than me comment on the viability of that.
It may be worthwhile removing the 390pF feedback cap to check squarewave response without that compensation assistance. Also worthwhile stating the load test conditions for any enclosed photo.
A good appreciation of LF response would need assessment below 10Hz. Hopefully the 220nF - 22nF//1M shelf networks, and the various feedback related LF roll-offs have done the job, although a frequency response curve would now indicate where phase and gain change is encroaching on the audio range.
A good appreciation of LF response would need assessment below 10Hz. Hopefully the 220nF - 22nF//1M shelf networks, and the various feedback related LF roll-offs have done the job, although a frequency response curve would now indicate where phase and gain change is encroaching on the audio range.
The T network is lead-lag compensation. The zero of the T network cancels the first pole in the system (the OPT) and replaces it with a new pole which is much lower. Its the LF equivalent of placing a cap across the FB resistor.
Yes I used three terminal in the g;obal NFB filter according to your schematic. Today I replaced Russian 6H8C tubesin invert stage with also Russian TungSol 6SN7 and balanced the CCS stages.The T network is lead-lag compensation. The zero of the T network cancels the first pole in the system (the OPT) and replaces it with a new pole which is much lower. Its the LF equivalent of placing a cap across the FB resistor.
- Home
- Amplifiers
- Tubes / Valves
- Testing newly built mullard 5-20