As I mentioned previously the tweak doesn't affect impedance curve at all if you add the extra impedance via Rg (instead of adding extra Re).
It's a still a fudge, as you're basically adding a source/cable impedance that does not actually exist to the sim. This is as bad as say adding imaginary path-length to a horn's simulation to make its sim'd Fb the same as its measured Fb.... 🙂
True.
But there is something better.
And it has been known for 20 plus years.
It is used in professional programs as it allows a person to model driver behavior in the mid to high frequencies with greater confidence.
The improvement does not effect the low frequency accuracy.
Part of what Anthony JAG has discovered is that published specs are not always accurate.
Again I have to applaud Anthony's horsesense in relating a cause and effect as well as a fix that moves him in the right direction when comparing his simulations to published measurements.
Let's see what happens when we get accurate T/S parameters.
From years of experience I can tell you that accurate Thiele Small parameters will produce accurate simulations.
JAG has posted his method. I'd say it represents an hypothesis. He has conducted experiments that indicate - at least to him - that his hypothesis may be correct.
In posting his results here, he has subjected the hypothesis and his results to peer review. That doesn't apply to people like me. But for others it does.
I would imagine that every new idea in this field has begun in a similar manner. But through collaboration among experts the ideas have been tested. In some cases research has actually resulted in mathematical formulas that are now incorporated into some of the sims being used.
I do not have an opinion whether JAG's method is accurate. I don't have the experience to be able to determine this.
But I believe JAG deserves credit for posting his hypothesis. I hope it will be given some consideration. It may or may not turn out to be accurate. But it does seem to be addressing an important issue. Such diligence should, in my opinion, be encouraged and acknowledged.
[Soapbox mode] OFF
Bach On
Hi Y'all,
I third that. It would be great if Mark could get updated T/S parameters for the SI HT18. There still would have to be frequency/impedance measurements of that particular driver in a known box for comparison.
Regards,
I third that. It would be great if Mark could get updated T/S parameters for the SI HT18. There still would have to be frequency/impedance measurements of that particular driver in a known box for comparison.
Regards,
Hi Y'all,
I third that. It would be great if Mark could get updated T/S parameters for the SI HT18. There still would have to be frequency/impedance measurements of that particular driver in a known box for comparison.
Regards,
I know that the current available driver is mounted on an infinite baffle in a car.
If we open the trunk and the car doors it will be essentially a free air measurement.
You can simulate that as an huge rear chamber on your enclosure.
What else I can do is use the fancy software to develop the proper simulation for all to see.
Might make a video of all this for kicks and giggles.
It's a still a fudge, as you're basically adding a source/cable impedance that does not actually exist to the sim. This is as bad as say adding imaginary path-length to a horn's simulation to make its sim'd Fb the same as its measured Fb.... 🙂
You are correct in that my method is not as scientifically rigorous as Leach's model but it's also not as speculative as guessing at imaginary path length in a design that has still never been simulated accurately. And my method has been shown to work 100 percent of the time with this type of driver in any type of enclosure. So use it or don't, it's up to you, but it's not an unproven hit or miss random shot in the dark. Or better yet you could develop your own better method. Since you (and most people) don't usually use the type of drivers that need this tweak you can comfortably ignore it if you like, but if you would like to criticize or question it, please refer to the results I've posted and find fault there first before attacking the method. The results are what matters.
What is (or should be) clear is that some drivers don't sim as expected even if you have accurate t/s. Data-bass shows this clearly as he measures t/s and FR of all the drivers. I've identified which drivers have the problem and how to fix the sim so you can continue to use published specs (or measured) and continue to use your favorite simulator.
The alternative is to ignore the issue and accept inaccurate sims or to spend the money for programs that will measure the complex inductance parameters and a simulator that will accept them. This also means you have to buy EVERY driver you want to sim and measure complex inductance t/s first.
Mark says there is such a simulator available (that can sim exotic enclosures) if you can afford it and there probably is, but I wonder if this whole extremely expensive process is going to give results any better than mt method if you take care to get the most accurate curve fit instead of just doubling Re.
Using Leach's method will always put you on stable ground with accurate results but the process of working with complex inductance parameters is very expensive and a lot of work. This might change as a broader cross section of the market starts using this type of drivers but at this point it's mostly just car audio and HT guys with more money than brains, and they still haven't figured out that these drivers don't sim as expected. Even on avs where this type of driver is used almost exclusively only a few guys know they don't sim right and they just ignore it anyway since there was nothing you could do about it. Even now with a working simple method most people don't know and don't care. Since most people don't measure they will never know they didn't hit their sim goals and have badly designed subs.
Anthony you are correct in surmising that a measured curve and a simulation massaged to fit it are correct.
And a little correction.
I measure with a box called the WooferTester Pro.
It will simulate the complex inductance for crossover and box work in regards to sealed and vented enclosure only.
Not the fancy enclosures we like to mess around with in Hornresp.
What makes Hornresp so powerful in that I have made many enclosures from accurately measured parameters that pretty much agree with what we generate in Hornresp.
What is usually different are the impedance plot magnitudes.
This is due to the simulation not taking into account any losses in the enclosure driver system.
The cherry on top of the sunday in regards to that is the closer your box measures to the simulation the better you have constructed your enclosure.
I have read with interest the explanations of how and why this happens.
Some of the information is correct some of it is simply guessing.
Here is a paper that sums up the difference between the simple and complex inductance calculations:
View attachment Transducer_equivalent_circuit.pdf
Anthony you are correct in surmising that a measured curve and a simulation massaged to fit it are correct.
And a little correction.
I measure with a box called the WooferTester Pro.
It will simulate the complex inductance for crossover and box work in regards to sealed and vented enclosure only.
Not the fancy enclosures we like to mess around with in Hornresp.
What makes Hornresp so powerful in that I have made many enclosures from accurately measured parameters that pretty much agree with what we generate in Hornresp.
What is usually different are the impedance plot magnitudes.
This is due to the simulation not taking into account any losses in the enclosure driver system.
The cherry on top of the sunday in regards to that is the closer your box measures to the simulation the better you have constructed your enclosure.
I have read with interest the explanations of how and why this happens.
Some of the information is correct some of it is simply guessing.
Here is a paper that sums up the difference between the simple and complex inductance calculations:
View attachment 496876
I've never played with complex inductance parameters because to be honest, for the reasons I've pointed out it's a model without a whole lot of utility. But from reading your recent comments and the linked paper, it seems these complex inductance parameters are even less useful than I previously thought.
You mentioned a couple of times, and the paper mentioned that the simple model breaks down in the higher frequencies but an accurate sim is possible if you use accurate t/s.
This is simply not true, look again at the data I posted, the tapped horn examples are particularly telling.
An externally hosted image should be here but it was not working when we last tested it.
An externally hosted image should be here but it was not working when we last tested it.
Accurate specs ARE used, the t/s pecs he measured right before he measured the FR. And clearly the results are massively inaccurate in the simple sim at ALL frequencies right down to Fb and even below, not just at higher frequencies. In fact the higher frequencies aren't even that particularly bad, it's mostly the lower frequencies that have a huge problem (although even the higher frequencies will be off by quite a bit after power correction).
Blow the pictures up and take a close look at the untweaked sim (the lighter trace) in both cases, it's just massively inaccurate at all frequencies. In both cases my simple generic tweak is exponentially more accurate.
This is Othorn tapped horn with Mach 5 UXL and Sundown ZV3.
BUT if you sim the same horn with the driver it was designed for, the B&C driver which does NOT suffer from this issue, the simple sim works exactly as expected with very accurate results. No tweak necessary because it's a pro driver, the type of driver that can be accurately simulated with simple t/s specs.
I'm interested to see if you can get anywhere near an accurate result with complex inductance parameters. It's starting to seem like they won't do the job either, nowhere near as well as my method, if they only correct at higher frequencies when the problem clearly affects the entire bandwidth.
This has nothing to do with impedance plot magnitudes, it's the frequency response that's massively inaccurate. I'm not saying the impedance magnitudes might not be off by a bit (but as you mentioned that's a problem with not calculating internal box losses), but that's hardly where the real problem lies. The real problem is massively inaccurate frequency response across the entire bandwidth even well below Fb.
Last edited:
Some people have mentioned adjusting Le alone to get a more accurate sim, some have suggested that just using accurate simple t/s specs will get a more accurate sim, some have suggested using complex inductance parameters (including myself although now it's looking like they won't work either) some have discounted the method as just a fudge.
This all has me wondering, has anyone actually taken a good measurement of a driver of this type (like a data-bass measurement) and tried to correlate it to a sim? All the details are there, the measured t/s and box dimension details and full measurement details as well as measurement conditions, measurement procedure and equipment used. I challenge anybody to find ANY method that will give a more accurate result on those tapped horn measurements in the last post than the simple generic tweak I use.
If people would actually try to do this, they would realize how inadequate all the other proposed methods are, and how accurate even my simple generic tweak is. There's LOTS of speculation going on here, and I don't see anyone putting in any work to correlate a sim to a known good measurement. I've done the work, and proved my method works every time, with every driver of this type, with every enclosure type. I've also done the work to show that none of the other methods work, although I haven't shown that work. But everyone can test their own favorite method and find out how inadequate all the other methods are.
At this point, it would seem that the complex inductance parameters and simulators would fall in that camp too, although I'd like to be able to do a fair comparison. As mentioned though, the problem is getting the complex inductance specs and finding a simulator that will accept them. Sounds like this is not an insurmountable challenge for Mark, but even so he still has to get his hands on the driver and accurately measure the complex inductance t/s. My method doesn't require ANY of that, it's a simple 2 second tweak and you get exponentially more accurate sims.
Last edited:
Not scientific what so ever - zero.You are correct in that my method is not as scientifically rigorous as Leach's model
You picked a parameter to tweak out of a hat (with no theoretical rationale what so ever), you choose an arbitrary cut-off point for inductance (with no theoretical...), you sussed out a weird manipulation (with no theoretical...), you hand-picked a few examples to illustrate, you made the wild and frequently repeated (and subjective) claim that your fit is "exponentially" better (I'm not sure if you know what "exponential" means or how it applies to subjective judgments).
Not scientific at all. Does not advance anybody's understanding of drivers, as others are vainly trying to tell you.
Whatever is going on in the bass, it isn't likely to be much related to coil inductance per se.
Ben
Last edited:
Yes, it is known for 24 years - I stumbled on the paper by Wright long time agoTrue. But there is something better. And it has been known for 20 plus years. It is used in professional programs as it allows a person to model driver behavior in the mid to high frequencies with greater confidence.
The improvement does not effect the low frequency accuracy.
J. R. Wright, “An Empirical Model for Loudspeaker Motor Impedance,” J. Audio Eng. Soc., vol. 38, pp. 749–754 (1990 Oct.)
But, as you pointed out, it does not effect the low frequency accuracy of the sims, and that problem is what we are discussing here. Method by just a guy works fine exactly on the low frequency band.
The real question is when we should use that method, besides suspiciously high woofer inductivity.
Last edited:
You are wrong. In the science, there is an empirical fitting - and that is exactly what just a guy did. True, with his method we don't advance in understating the drivers, but we do advance in drivers sims.Not scientific what so ever - zero.
You picked a parameter out of a hat (with no theoretical rationale what so ever), you choose an arbitrary cut-off point for inductance (with no theoretical...), you sussed out a weird manipulation (with no theoretical...), you hand-picked a few examples to illustrate, you made the wild (and subjective) claim that your fit is "exponentially" better (I'm not sure if you know what "exponential" means or how it applies to subjective judgments).
Not scientific at all. Does not advance anybody's understanding of drivers, as others are vainly trying to tell you.
"Magnitude better" is better description than "exponentially better", I believe.
Not scientific what so ever - zero.
You picked a parameter to tweak out of a hat (with no theoretical rationale what so ever), you choose an arbitrary cut-off point for inductance (with no theoretical...), you sussed out a weird manipulation (with no theoretical...), you hand-picked a few examples to illustrate, you made the wild and frequently repeated (and subjective) claim that your fit is "exponentially" better (I'm not sure if you know what "exponential" means or how it applies to subjective judgments).
Not scientific at all. Does not advance anybody's understanding of drivers, as others are vainly trying to tell you.
Whatever is going on in the bass, it isn't likely to be much related to coil inductance per se.
Ben
Clearly you didn't read any of the many links in which I discuss how I came up with this method. I didn't start picking parameters out of a hat and start tweaking them, I already knew exactly what parameter to tweak just by looking at the measurements.
For years when I looked at measurements of this type of driver on data-bass I recognized the response curve shape - it looked exactly like what you see when you add Re to simulate power compression. What I did not know (until I tried it) was how well this method would work. I never attempted to tweak any parameter except Re.
And scientifically it does make sense, since there's already another model (complex inductance) that does essentially the same thing, although at this point I'm doubting if it's anywhere near as accurate as my method at low frequencies.
There is no other parameter you can tweak that will give results anything like this, except Bl, which is almost the same thing as tweaking Re and adjusting power to compensate for losses.
And scientifically that makes sense too, as Djim pointed out, a long. large coil with lots of windings has lots of losses, and these are the parameters that will show this type of losses.
I showed a few examples, but I simulated and correlated ALL the high quality measurements of this type of driver that I could find. Mostly data-bass measurements, and other measurements from Ricci that he didn't put on data-bass. I did the work, don't try to make it seem like I didn't. If you want more examples just ask.
Exponentially, orders of magnitude better, pick whatever semantics you like. Just use your eyes and look at the sims tweaked and untweaked and tell me that the tweaked version is not vastly better in all examples.
The point of this is not to advance your understanding of drivers (although demonstrating that there is a problem and showing how to solve it does exactly that in a sense, although this is admittedly not a study on the cause of the issue), the point was to show a method to make sims more accurate 100 percent of the time with this type of driver in any type of enclosure.
Since Kravchenko mentioned this wasn't likely related to inductance per se a long time ago, I have since found at least a few low(ish) inductance drivers that also have this problem, and subsequently stopped calling it an inductance problem. But it is clearly an issue with large coil/motor drivers. Try to keep up, this all happened in threads you were actively participating in.
Ben, I'd like to see your approach to solve this problem. If you have anything at all useful to say instead of just ill informed critiques, let's see your scientific method that solves this problem.
Anyway, if you actually look at the examples I posted you will see this method works in every example, and I assure you in all the dozens of other examples I didn't post. Do you see a fault with the correlations shown (showing much better match with tweaked than untweaked sims) or are you just looking for something to argue about?
Last edited:
Hi Y'all,
Just pondering:
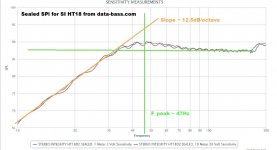
When I look closer @ the data-bass.com SI HT18 SPL curve, and apply the JAG-Tweak to it, the low end slope of the curve gets a little bit too steep, and the peak of the hump ends up a little too low, as JAG said, he didn't try for accuracy on this example.
When I use 2.5 Ohm added to Rg instead of 3.5 the low end and peak look very similar to the data-bass SPL curve. I cannot see any difference between adding to Rg or to Re.
Also, keeping Re and Rg @ their original values, but using Bl=16 instead of the original 21.34 gives the same slope as the Re-Tweak w/ a slightly higher overall SPL (see: attached).
I didn't change Eg for either method.
With small adjustments this looks like a valid work-around for a nasty problem. On principle I like the Bl method better, but both seem to work.
Regards,
Just pondering:
When I look closer @ the data-bass.com SI HT18 SPL curve, and apply the JAG-Tweak to it, the low end slope of the curve gets a little bit too steep, and the peak of the hump ends up a little too low, as JAG said, he didn't try for accuracy on this example.
When I use 2.5 Ohm added to Rg instead of 3.5 the low end and peak look very similar to the data-bass SPL curve. I cannot see any difference between adding to Rg or to Re.
Also, keeping Re and Rg @ their original values, but using Bl=16 instead of the original 21.34 gives the same slope as the Re-Tweak w/ a slightly higher overall SPL (see: attached).
I didn't change Eg for either method.
With small adjustments this looks like a valid work-around for a nasty problem. On principle I like the Bl method better, but both seem to work.
Regards,
Attachments
The real question is when we should use that method, besides suspiciously high woofer inductivity.
And that's a very good question. I don't think OP's other driver (Dayton 385) needs the tweak, as it's a low(ish) power driver with a small 2.5 inch vc and low xmax. Clearly this SI driver does need it, as I showed.
High inductance (over 1:1 Le:Re ratio) almost always indicates the tweak is necessary, but there are other drivers like the Dayton HO (also measured at data-bass) that don't present as ultra high inductance that also need the tweak. The HO is a much larger coil, almost 2x more xmax and power handling.
At this point, without a scientific method to determine which drivers will need the tweak you could measure any driver in question in a sealed box and see if it has what has previously always been referred to as an "inductance hump".
If you don't want to do that, you can guess pretty well just by looking at the xmax and power handling spec, if it's higher than traditionally normal it's probably going to need it. Even better would be to know the vc winding info - gauge of wire, height, width, number of layers, etc, but that isn't published info and you can't find out without destroying the driver.
BUT, in most cases I have accurately identified this type of driver just by looking at a picture of it. If it's got a big motor and a big surround it's almost certainly going to need the tweak. Unfortunately, some drivers like the Dayton HO don't indicate for sure in the appearance that they need the tweak. Unscientific to be sure, but a lot of the time it works fine.
Hi Y'all,
Just pondering:
When I look closer @ the data-bass.com SI HT18 SPL curve, and apply the JAG-Tweak to it, the low end slope of the curve gets a little bit too steep, and the peak of the hump ends up a little too low, as JAG said, he didn't try for accuracy on this example.
When I use 2.5 Ohm added to Rg instead of 3.5 the low end and peak look very similar to the data-bass SPL curve. I cannot see any difference between adding to Rg or to Re.
Also, keeping Re and Rg @ their original values, but using Bl=16 instead of the original 21.34 gives the same slope as the Re-Tweak w/ a slightly higher overall SPL (see: attached).
I didn't change Eg for either method.
With small adjustments this looks like a valid work-around for a nasty problem. On principle I like the Bl method better, but both seem to work.
Regards,
Doubling Re by literally doubling Re will affect the impedance curve, it will double Re.
Doubling Re by adding Rg = Re will not affect the impedance curve at all.
Decreasing Bl will affect the impedance curve by slightly changing the magnitude of the peaks.
Also, using Bl instead of Re or Rg will provide slightly different FR curve.
Also, using Re or Rg will make some other graphs less accurate (or useless) because of the sensitivity issue, the Bl tweak preserves the integrity of the other graphs the simulator can generate.
That's the difference.
But as you found out, you can get more accuracy pretty quickly by doing the curve fit match more accurately. Unfortunately, as Brian pointed out, this requires a LOT of confidence in the accuracy of the FR measurement you are fitting the sim to, or you are just adding measurement errors into the sim, and that will be bad.
This is why I only used highly reputable measurements to test the method.
And all this only makes sense, some drivers will have more of a problem than others, they will need more adjustment if you want highest accuracy sims. But as I showed, the generic simple tweak is already pretty good, it's the only one I've shown so far, I didn't strive for extra accuracy in any of the shown sims to show that even at it's purest simple level the tweak is already very good for all drivers in all enclosures.
Last edited:
Stereo Integrity HT18 Measured 4 ohm wiring.
Buffer[1] Altec Vas Ver 7.01
Completed: Mon Aug 03 17:36:08 2015
Drive level 100.000% [3.477 mA]
Sine,LoZP(LV/LA)->Vas,23 pts
;------------------------------------------------------------------
Re = 3.8905 ohms
Fs = 17.8978 Hz
Zmax = 37.0127 ohms
Qes = 0.5616
Qms = 4.7809
Qts = 0.5025
Le = 3.6920 mH (at 1 kHz)
Diam = 387.3500 mm ( 15.2500 in )
Sd = 117841.1543 mm^2(182.6542 in^2)
Vas = 184.9278 L ( 6.5307 ft^3)
BL = 25.6356 N/A
Mms = 843.5236 g
Cms = 93.7440 uM/N
Kms = 10667.3457 N/M
Rms = 19.8412 R mechanical
Efficiency = 0.1774 %
Sensitivity= 84.5076 dB @1W/1m
Sensitivity= 87.6385 dB @2.83Vrms/1m
Krm = 52.781E-03 ohms Freq dependent resistance
Erm = 637.558E-03 Rem=Krm*(2*pi*f)^Erm
Kxm = 48.447E-03 Henries Freq dependent reactance
Exm = 699.829E-03 Xem=Kxm*(2*pi*f)^Exm
;------------------------------------------------------------------
Ftest = 15.867 Hz
Ftest/Fms = 0.8866
Test Mass used = 229.7000 g (Equal to 45.9 nickels)
Test Mass (Ft=Fms*0.90) = 197.864 g (Add -31.836g for Ft=16.108)
Test Mass (Ft=Fms*0.75) = 656.074 g (Add 426.374g for Ft=13.423)
---------------------------------------------------------------------------------------
* The base TS model will be affected by Cms variation caused by break-in, heating, or *
* changes in suspension components. BL, Re, Rms, Mms etc are assumed to be constant *
---------------------------------------------------------------------------------------
pct Fs-Hz Cms-um/N Vas-L Qms Qes Qts
25.0% 8.9489 374.9761 739.7112 2.3905 0.2808 0.2513
31.5% 10.0448 297.6187 587.1091 2.6832 0.3152 0.2820
39.7% 11.2749 236.2202 465.9889 3.0118 0.3538 0.3166
50.0% 12.6557 187.4881 369.8556 3.3806 0.3971 0.3553
63.0% 14.2055 148.8094 293.5546 3.7946 0.4457 0.3989
79.4% 15.9451 118.1101 232.9944 4.2593 0.5003 0.4477
100.0% 17.8978 93.7440 184.9278 4.7809 0.5616 0.5025 <- base TS
126.0% 20.0896 74.4047 146.7773 5.3664 0.6303 0.5641
158.7% 22.5498 59.0550 116.4972 6.0236 0.7075 0.6331
200.0% 25.3113 46.8720 92.4639 6.7612 0.7942 0.7107
252.0% 28.4110 37.2023 73.3886 7.5892 0.8914 0.7977
317.5% 31.8903 29.5275 58.2486 8.5186 1.0006 0.8954
400.0% 35.7956 23.4360 46.2319 9.5618 1.1231 1.0051
Last edited:
You are wrong. In the science, there is an empirical fitting - and that is exactly what just a guy did. True, with his method we don't advance in understating the drivers, but we do advance in drivers sims.
"Magnitude better" is better description than "exponentially better", I believe.
Do you know the difference between empirical research versus playing Super Mario?
Playing arbitrary games with a video game or software program in order to "win" is not research into a phenomenon. At best, it is "research" into how the "black box" of the app works. No big deal since all this is well documented long ago. Nothing valuable there. Just gamesmanship.
Ben
Last edited:
- Status
- Not open for further replies.
- Home
- Loudspeakers
- Subwoofers
- Tapped Horn Cabinet for 16 Hz. organ speaker