I'm confused (not for the first or last time ) about Qtc. Here are two conflicting quotes, but which is correct? Thanks for the help.
From Vandersteen:
" In Subwoofer engineering terms, system Q is the product of a complex mathematical equation derived from driver, electrical and enclosure parameters. In practical terms, it relates to the character of the bass response. A low Q subwoofer sounds highly damped and very tight. A high Q subwoofer produces a warm loose bass with more energy in the most audible bass range. The trick has always been to try to find the subwoofer with the Q that best matched your listening room and personal tastes.
The 2Wq is the first subwoofer to feature adjustable Q.A bass contour control on the rear panel allows you to set the system Q anywhere from ..5 (Slightly overdamped, i.e.., tight jazz sound) to 1.2 (Significantly underdamped, i.e.., typical mass-market home theater sound)."
From GRollins:
"A point that tends to get lost in the shuffle is the Q of the (sub)woofer. Critically damped (i.e. .707) is a maximally flat Butterworth alignment. Bessel will give you .5, etc. The thing is that some people go for a .5 alignment because it 'gives you more bass.' Hmmm...well, yes...and no. It rolls off more slowly, but begins rolling off sooner (i.e. higher up). A properly designed .707 cabinet will roll off with a sharper slope (which some chose to interpret as 'less bass') but stays within a tighter range in the pass band and the rolloff begins at a lower frequency. Your choice. But there's a catch. Going for a Q of .5 to get 'more bass' means a compromise--the bass you get is less tight. You want really tight bass? Try a Q of 1 or more . Of course, now you've got a pronounced hump just before rolloff, but hey, you wanted tight bass.
The stereo gods giveth and the stereo gods taketh away."
) about Qtc. Here are two conflicting quotes, but which is correct? Thanks for the help.From Vandersteen:
" In Subwoofer engineering terms, system Q is the product of a complex mathematical equation derived from driver, electrical and enclosure parameters. In practical terms, it relates to the character of the bass response. A low Q subwoofer sounds highly damped and very tight. A high Q subwoofer produces a warm loose bass with more energy in the most audible bass range. The trick has always been to try to find the subwoofer with the Q that best matched your listening room and personal tastes.
The 2Wq is the first subwoofer to feature adjustable Q.A bass contour control on the rear panel allows you to set the system Q anywhere from ..5 (Slightly overdamped, i.e.., tight jazz sound) to 1.2 (Significantly underdamped, i.e.., typical mass-market home theater sound)."
From GRollins:
"A point that tends to get lost in the shuffle is the Q of the (sub)woofer. Critically damped (i.e. .707) is a maximally flat Butterworth alignment. Bessel will give you .5, etc. The thing is that some people go for a .5 alignment because it 'gives you more bass.' Hmmm...well, yes...and no. It rolls off more slowly, but begins rolling off sooner (i.e. higher up). A properly designed .707 cabinet will roll off with a sharper slope (which some chose to interpret as 'less bass') but stays within a tighter range in the pass band and the rolloff begins at a lower frequency. Your choice. But there's a catch. Going for a Q of .5 to get 'more bass' means a compromise--the bass you get is less tight. You want really tight bass? Try a Q of 1 or more . Of course, now you've got a pronounced hump just before rolloff, but hey, you wanted tight bass.
The stereo gods giveth and the stereo gods taketh away."
The following thread contains the response curves for closed boxes with various values of Qtc. As you can see, A Qtc of .5 does indeed roll off quicker.
http://www.diyaudio.com/forums/showthread.php?threadid=8071
http://www.diyaudio.com/forums/showthread.php?threadid=8071
I know that the low-Q design will have a gentle low-frequency roll-off starting at a high-frequency and that high-Q will have the opposite tendencies, in general.
I've always thought that high-Q=steeper roll-off slope=greater group delay= 'loose' bass. This is what Vandersteen is stating. However, GRollins seems to be indicating the opposite.
I've always thought that high-Q=steeper roll-off slope=greater group delay= 'loose' bass. This is what Vandersteen is stating. However, GRollins seems to be indicating the opposite.
Here's another quote from Jon Rasmussen at vacuumstate.com:
"It has been known for some time that where-ever there is a resonance, if the Q is kept down to or below 0.5 it can be described as critically damped, so hence the title, a Critical Q Sub, short for Critically Damped Q Sub-Woofer. This Sub will have superb transient response with virtually no over-hang and will start and stop on a dime."
Again, this is in agreement with Vandersteen but opposite of Grey's statement.
Note: I'm not trying to disprove Grey's statement, I'd just like to make sure I build my box with the correct Q for my needs.
My thoughts.
I just modeled a few Shiva in sealed boxes. It's interesting to note that the box with Qtc of 0.7 actually has a higher value of group delay than the Qtc 1.0 box, but we are talking less than 1 ms difference, and the peak is 20 Hz lower on the box with higher group delay. As to F3, it really doesn't change all that much. Qtc of 1.0 vs Qtc of 0.5 are have virtually identical F3's, which are only about 10% higher than a Qtc 0.7 box.
ANYHOW! I personally have listened to the same woofer in a box with Qtc of 0.7 and a box with Qtc of 1.1. There was no comparison as to which one sounds tighter and more accurate, the lower Q definitely was the best.
It's difficult to explain why using group delay figures however, because even a box with a Qtc of 1.5 is going to have considerably less group delay than a vented box in the bottom two octaves, or the bottom octave anyhow.
I think it's just more intuitive to use the definition of Q, or resonance damping. A higher Q has less damping of the natural resonance, and so is less able to control the woofer cone. Less control equals less tight bass in my book. On the other hand, that seems a little counterintuitive, as you would think a smaller box has more control over the woofer, being a stiffer spring and all... grr. Oh well, least I know my subjective tests are valid.
Serow,
To address your last point about overhang, this is one of the very things I noticed quite a lot with the high Qtc box. The bass most certainly did not stop and start on a dime! More like on a silver dollar...
Aaron Gilbert
In addition to the previous link I gave, which had the response shape at various frequencies for various values of Qtc, here is the "step response" of variious values of Qtc, (and Qts in free air as well).
The "step response" means one square pulse, I believe with the wavelength of the frequency of resonance. Anyway, you can see how transient response and overhang are different for different values of Qtc.
The graph in the previous link I gave and this following graph will give you some idea of the tradeoffs between strong response and "overhand", "tightness", etc. I think you should have the whole picture now. It is up to the listener to decide between how much amplitude he wants versus how little distortion and "overhang".
Incidentally, the following graph is taken, with some minor additional graphic work, from the article "Closed-Box Loudspeaker Systems Part 1: Analysis" in the December 1972 issue of the Journal Of The Audio Enginneering Society. It was reprinted in their Loudspeaker Anthology Part 1. The author is Richard Small, of Thiele-Small reknown.
Attachments
Believe Joe. What Grey is saying is only part of the story. With room gain a sub designed for flat anechoic response has way too much bass. You want your sub to roll off smoothlyin an amount just opposite that of your room gain. A bessel (Q=0.5) is probably the best choice in most rooms And as far as the actual box gives the best phase response -- critical Q. The downside is that this is often a pretty big box -- and if its your thing, won't give you the over exaggerated bass some like for their movies.
dave
dave
I would just like to add that research has shown the farther down the frequency scale we go, the less we are able to percieve distortions and overhang. What is acceptable at 30 Hz might not be acceptable at 300 Hz.
Also, the step response of Qtc = 1 is superior to just about any vented box alignment. Transient response and "overhang" vary with vented box alignment as well, but all of the common vented box alignments have worse step response than the Qtc. = 1 response.
What Grey is saying is that Qtc = 1 is the best combination of frequency response and low distortion. It is a matter ot taste, but the output at Qtc = 1 is 6 dB higher at the resonance frequency than Qtc = .5, and the "overhang" is not that far behind.
I'll be posting the step response of some common vented alignments in another thread, but not tonight. The difference is apparent.
PS: I'm a vented box fan. I like the extra output. But I think the people on this forum should be allowed to judge for themselves.
Most of the speaker designers from the sixties and seventies went for Qtc's between .7 and 1. But what Planet 10 is saying is indicative of a new wave of thinking, where the gradual rolloff splices into the room gain-the tendency of most rooms to emphasize lower bass frequencies.
With higher powered amps readily available and cheaper than in the sixties and seventies, plus with more low low frequency content existing on CD's now, perhaps the low Qtc path is the way to go. It's a matter of taste.
Below is a graph of typical "room gain". Some programs give higher values-Pyle Industries tech support gave me a higher number at 16 Hz than this chart indicates-9 dB as opposed to 7 dB-but it is all just an average anyway. Bass response will vary not only from room to room, but even in different spots in the same room.
Attachments
dont despair serow. if you want to keep Q low and still have a small box yo can fudge a bit (upto about 20% of box volume in my expriments) bymaking the box aperiodic.
there are 2 ways of doing this. one way is to build a port into the sealed box and fill the port with glass wool or whatever damping material yo are using for box. I have used a 4" dia x 8" long port with a 12" woofer ito good effect. You can describe this as a Super short over damped TL or maybe simply as damped port.
the other is a bit trickier and works for larger boxes. divide box into 2 parts. cut hole in the dividing panel and reseal hole with open cell foam. I use 30mm MDF for my boxes and hence the dividing panel is 30mm MDF too so I use 50mm opencell foam to reseal the hole. The rest of box (both parts) sholud be damped as usual. Focal or somneone has a projct with this construction. too bad my failing memory lets me down. an variation of this is a thee box design.
Using 2 woofers divide box into 3 parts. the center part is without a woofer. the rest is the same. again i used this technique to reduce Q in a 120 liter box housing 2 12" Audio Concepts woofers.
Thanks a lot for the constructive replies guys. I have thought about this alot today.
Kelticwizard, that step response graph is very helpful, but also misleading. The horizontal scale is normalized with the time constant Tc on the denomenator. However, Tc is a function of Q. In particular Tc=Q/Wn, where Wn is the fixed 'break' frequency of the box. That means that the horizontal scale on each of the graphs is different.
To achieve a set of graphs that are directly comparable, the horizontal scale of each graph needs to be scaled inversely by the value of Q ie for Q=2 graph shrink the graph horizontally by a factor of two.
If someone with graphics knowledge could do this for all the graphs I would be greatly appreciative .
I have more thoughts to post, but have to leave shortly.
Regards,
Eric
Kelticwizard, that step response graph is very helpful, but also misleading. The horizontal scale is normalized with the time constant Tc on the denomenator. However, Tc is a function of Q. In particular Tc=Q/Wn, where Wn is the fixed 'break' frequency of the box. That means that the horizontal scale on each of the graphs is different.
To achieve a set of graphs that are directly comparable, the horizontal scale of each graph needs to be scaled inversely by the value of Q ie for Q=2 graph shrink the graph horizontally by a factor of two.
If someone with graphics knowledge could do this for all the graphs I would be greatly appreciative
.I have more thoughts to post, but have to leave shortly.
Regards,
Eric
I could shrink the graphs horizontally inversely proportional to Qtc easy enough. There is a freeware program called XnView, as well as MS Paint.
Actually, I knew nothing of graphics until I started posting here. Almost all my knowledge of graphics comes from posting various pics and graphs here. That is why I love the board-I get to talk and learn about loudspeakers, and increase graphics knowledge at the same time.
However, I am still not sure that the graph is misleading. I am not quite following your explanation. This is not surprising, since advanced math-which I define as anything past 4th grade arithmetic-is not my strong suit.
Moreover, the article and graph are by Richard Small, truly one of the audio pioneers.
Be that as it may, if you want I can scan the entire article and Email it to you. If you are still convinced the graphs are misleading, I can scale the horizontal inversely proportionately to Qtc and post it here. Might be fun.
Incidentally, scaling things horizontally would not affect the amplitude of the "hangover", would it? I put the numbers next to the .5 and -.5 marks just so the viewer can see that at Qtc = 2, the overshoot is half as great as the original pulse amplitude. That would not change with scaling the horizontal, would it?
Hi Kelticwizard, Eric,kelticwizard said:Incidentally, scaling things horizontally would not affect the amplitude of the "hangover", would it? I put the numbers next to the .5 and -.5 marks just so the viewer can see that at Qtc = 2, the overshoot is half as great as the original pulse amplitude. That would not change with scaling the horizontal, would it?
No changing the horizontal scale would not effect the amplitude. Each of the Small graphs that Kelticwizard has posted are normalized to generalize the horizontal axis. In this way you can scale the graph or not and the information presented by the graph is still valid. If you do scale one of the graphs and wish to compare your results with information from one of the other graphs in the set, you must scale the other graph exactly as you did the first.
Rodd Yamashita
Sorry for the confusion everyone, but I messed up in my calculations. If anyone wants to know, the correct formula for converting between damping ratio Zeta (Z) and Q is Q=0.5/Z . Knowing this, I relabelled the step response graph:
Source is
http://gold.skku.ac.kr/tutor/gpdocs/multiplt.htm
Q=5 Q=2.5 Q=1.667 Q=1.25 Q=1.0 Q=0.707 Q=0.5 Q=0.25 [/B][/QUOTE]
Source is
http://gold.skku.ac.kr/tutor/gpdocs/multiplt.htm
Q=5 Q=2.5 Q=1.667 Q=1.25 Q=1.0 Q=0.707 Q=0.5 Q=0.25 [/B][/QUOTE]
Attachments
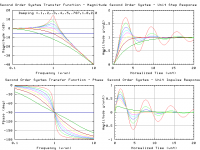
This means that the original graph that Kelticwizard posted from Small's paper is 100% correct. Please ignore the scaled graph.
In summary:
Q=0.707 Fastest settling time, some overshoot
Q=0.5 Slightly slower settling time than Q=0.707, but less overshoot (better control of cone)
Q=1.0 Slightly slower settling time than Q=.5, significantly more overshoot, but more output at resonance and less distortion.
I think I'll try for Q=0.7-0.5. I wonder if most diyers realize how small the difference is between these two values of Q?
Note: if a mod were so inclined, they could remove or allow me to edit the original standard response graph post and subsequent "can be clearly seen" post.
i did not want to influence you earlier so i did not reveal this...my experimetns with Q also lead to having a Q of around 0.6.
why i dont know. i only used my ears and music as instruments.
i dont think this is ahrad and fast rule. maybe it worked in my room in my speaker locations etc...so please feel free to expriment. i know others who prefer a Q of 0.8 or so. a bit over 0.7.
why i dont know. i only used my ears and music as instruments.
i dont think this is ahrad and fast rule. maybe it worked in my room in my speaker locations etc...so please feel free to expriment. i know others who prefer a Q of 0.8 or so. a bit over 0.7.
Dave,
Serow is right about being off topic. Maybe you could move the TL posts to my thread here: http://www.diyaudio.com/forums/showthread.php?s=&postid=90328#post90328 or start a new thread?
Are you referring to the “small” numerical difference between .5 and .7?
Rodd Yamashita
Serow is right about being off topic. Maybe you could move the TL posts to my thread here: http://www.diyaudio.com/forums/showthread.php?s=&postid=90328#post90328 or start a new thread?
Serow,Serow said:...I think I'll try for Q=0.7-0.5. I wonder if most diyers realize how small the difference is between these two values of Q?
Are you referring to the “small” numerical difference between .5 and .7?
Rodd Yamashita
No, I was referring to the original Small setlling time graph earlier in the thread. The difference between both the settling time and cone overshoot of the Q=0.5 and Q=0.707 designs is very small.
However, the frequency response is different. The Q=0.5 box is 6db down at resonance, possibly matching better with room gain than the Q=.707 box, which is 3 dB down at the same frequency.
This was suggested by Dave earlier in the thread.
However, the frequency response is different. The Q=0.5 box is 6db down at resonance, possibly matching better with room gain than the Q=.707 box, which is 3 dB down at the same frequency.
This was suggested by Dave earlier in the thread.
- Home
- Loudspeakers
- Subwoofers
- Subwoofer Qtc and 'tightness'