Hi guys , reading the Shannon theorem i have found a trick
Is quiet that theorem tell the maximum frequencies for your signal from analog to digital becomes a maximum value of fc/2 where fc is a sample rate .
But if you have a pure sine tone at frequencies 15khz and
using acquisition asynchronous Samples describing
a 2 other tones at low frequencies generated from data output of dac
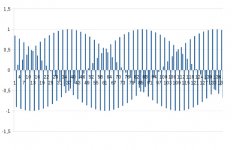
the calculus is sin(2*3.14159*15000*kt) and for example
t = 1/44100 if iu put this under a spreadsheet and print result of ideal smple rate you can see the envelope
the problem start about at fc/9 and have minimums at
fc/3 and fc/9 . Nearest this values the acquisition create a sine frequncies modulation .
I think the problem is the sinc on atempt of recostruction
of signal next post the immages of results
Is quiet that theorem tell the maximum frequencies for your signal from analog to digital becomes a maximum value of fc/2 where fc is a sample rate .
But if you have a pure sine tone at frequencies 15khz and
using acquisition asynchronous Samples describing
a 2 other tones at low frequencies generated from data output of dac
the calculus is sin(2*3.14159*15000*kt) and for example
t = 1/44100 if iu put this under a spreadsheet and print result of ideal smple rate you can see the envelope
the problem start about at fc/9 and have minimums at
fc/3 and fc/9 . Nearest this values the acquisition create a sine frequncies modulation .
I think the problem is the sinc on atempt of recostruction
of signal next post the immages of results
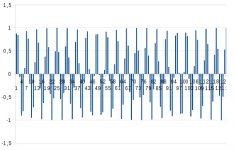
About fc/6
Nearest Fc/6 another trick sine have 7500hz .
If the sinc on the conversion DA is not assailable to an impulse the result is another modulation in the end
the samples lost the phase information
Nearest Fc/6 another trick sine have 7500hz .
If the sinc on the conversion DA is not assailable to an impulse the result is another modulation in the end
the samples lost the phase information
Attachments
Last edited:
You need to find out what a reconstruction filter does. Then you will understand why hi-end audio chains can be built without vinyl.
This isn't a digital problem, if you combine two tones and cut them into vinyl, you'll see the same "envelope" effect on playback.
The OP is seeing ultrasonic images, which the reconstruction filter will remove. These images, if left unfiltered, will cause beats with the wanted sound as he shows in his plots. It is quite common for people who don't understand digital audio to frighten themselves in this way.
The OP is seeing ultrasonic images, which the reconstruction filter will remove. These images, if left unfiltered, will cause beats with the wanted sound as he shows in his plots. It is quite common for people who don't understand digital audio to frighten themselves in this way.
The beats are visual only, a 1000Hz and a 1001Hz signal combined in any context will have an apparent 1Hz envelope but there is no 1Hz content. A non-linear transfer function is needed to create actual signal content, vinyl has lots of that.
Last edited:
simulation
There is no combination about any 2 tones .
the result is ideal ADC by a sheet or on matlab or on octave
or others mathematical programs
The print is only samples without no interpolation the
calculus is sin( 2*3.14159*fo*kt) where kt is the time of samples k= 1,2,3,,.....,n or
k=,number-start,+1,+2,+3,+4,+n,number-end , t=1/44100Hz , fo=15000Hz
Printed are the result .
On sheet by example k=12 t=1/44100Hz
| k | Amplitude |
| 12 | =sin( 2*3.14159*15000*12* 2.2676e-05)|
| 13 | =sin( 2*3.14159*15000*13* 2.2676e-05)|
| 14 | =sin( 2*3.14159*15000*14* 2.2676e-05)|
.........
| n | =sin( 2*3.14159*15000*n* 2.2676e-05)|
a variation you can put a delay
Last edited:
The beats are from 2 tones this is a type of modulationThe OP is seeing ultrasonic images, which the reconstruction filter will remove. These images, if left unfiltered, will cause beats with the wanted sound as he shows in his plots. It is quite common for people who don't understand digital audio to frighten themselves in this way.
Summation isn't modulation.
When I get a chance today, I'll combine two analog function generators and feed an analog scope and take a picture of the EXACT SAME THING.
When I get a chance today, I'll combine two analog function generators and feed an analog scope and take a picture of the EXACT SAME THING.
Summation ?!?
Where you see a summation?
Made the example and think an answer !
Summation isn't modulation.
When I get a chance today, I'll combine two analog function generators and feed an analog scope and take a picture of the EXACT SAME THING.
Where you see a summation?
Made the example and think an answer !
more on simulation
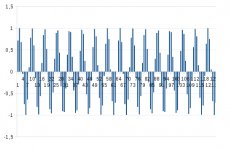
Delay you sum only at (kt+tau) or (kt-tau) where tau is a delay time in seconds
Plot on y axis the amplitude on x axis the k values
There is no combination about any 2 tones .
the result is ideal ADC by a sheet or on matlab or on octave
or others mathematical programs
The print is only samples without no interpolation the
calculus is sin( 2*3.14159*fo*kt) where kt is the time of samples k= 1,2,3,,.....,n or
k=,number-start,+1,+2,+3,+4,+n,number-end , t=1/44100Hz , fo=15000Hz
Printed are the result .
On sheet by example k=12 t=1/44100Hz
| k | Amplitude |
| 12 | =sin( 2*3.14159*15000*12* 2.2676e-05)|
| 13 | =sin( 2*3.14159*15000*13* 2.2676e-05)|
| 14 | =sin( 2*3.14159*15000*14* 2.2676e-05)|
.........
| n | =sin( 2*3.14159*15000*n* 2.2676e-05)|
a variation you can put a delay
Delay you sum only at (kt+tau) or (kt-tau) where tau is a delay time in seconds
Plot on y axis the amplitude on x axis the k values
Beats can be heard too; the envelope is real, not apparent. However, as you say, to get a signal component at the beat frequency you need some nonlinearity too.scott wurcer said:The beats are visual only, a 1000Hz and a 1001Hz signal combined in any context will have an apparent 1Hz envelope but there is no 1Hz content. A non-linear transfer function is needed to create actual signal content, vinyl has lots of that.
Your plot appears to be a signal sampling which probably had no antialiasing filter and definitely has not been followed by a reconstruction filter. Hence you are confusing yourself.gumo73 said:the result is ideal ADC by a sheet or on matlab or on octave
or others mathematical programs
Learn how digital audio works.
Antialiasing
The acquisition of an ideal ADC attempt to generate a samples from a pure tone this means there isn't frequencies different from fo on the Fourier domain
in the end fo is inside Shannon band fc/2 and don't need
an antialiasing filter .
This came from signals learning
Beats can be heard too; the envelope is real, not apparent. However, as you say, to get a signal component at the beat frequency you need some nonlinearity too.
Your plot appears to be a signal sampling which probably had no antialiasing filter and definitely has not been followed by a reconstruction filter. Hence you are confusing yourself.
Learn how digital audio works.
The acquisition of an ideal ADC attempt to generate a samples from a pure tone this means there isn't frequencies different from fo on the Fourier domain
in the end fo is inside Shannon band fc/2 and don't need
an antialiasing filter .
This came from signals learning
Last edited:
Recostruction filter
Reconstruction filter spline pass trough the original samples
if samples generate a one or more tones .
One or more tones are present on result signal ( under Fourier domain ) .
But it does need a reconstruction filter. That will get rid of all the beats.
Reconstruction filter spline pass trough the original samples
if samples generate a one or more tones .
One or more tones are present on result signal ( under Fourier domain ) .
Reconstruction filters do not use spline functions. An ideal reconstruction filter uses a sinc response in the time domain, and a sharp cutoff in the frequency domain.
As I keep saying, learn about digital audio. You have not found a flaw in the Shannon sampling theorem; you have merely shown that you need to do some more reading. If it is any consolation, I went through a period of similar confusion some years ago: I couldn't understand how digital audio worked, but unlike you I was certain that it did work. In time I acquired the understanding I lacked at first.
As I keep saying, learn about digital audio. You have not found a flaw in the Shannon sampling theorem; you have merely shown that you need to do some more reading. If it is any consolation, I went through a period of similar confusion some years ago: I couldn't understand how digital audio worked, but unlike you I was certain that it did work. In time I acquired the understanding I lacked at first.
Beats can be heard too; the envelope is real, not apparent. However, as you say, to get a signal component at the beat frequency you need some nonlinearity too.
OK, I meant to say do all the right things and that envelope in the result is still there. The OP has confused himself for sure.
- Status
- Not open for further replies.
- Home
- Member Areas
- The Lounge
- Shannon ad fc/2 tricks