still waiting gumo...I'm still waiting for him to tell me which of my two signals has more energy.
Here's a hint:
1st signal: 1, 0, -1, 0...
2nd signal: sqrt(2) sqrt(2) -sqrt(2) -sqrt(2)...
Pergo, why do you continue to feed it??
Because i'm curious to see his math demonstration about modulation. 😉
Modulation has a strong math definition, that produces a typical spectrum.
If we simply apply the definition and see the spectrum, we can clearly see that's not a modulation.
But gumo73 won't listen. 🙂
So...i'm curious about his mathematical demonstration.
Signals
If there is 2 sine with opposite phase and the same Vmax have digital median null .
What you think about seeing in the fft graph
Because i'm curious to see his math demonstration about modulation. 😉
Modulation has a strong math definition, that produces a typical spectrum.
If we simply apply the definition and see the spectrum, we can clearly see that's not a modulation.
But gumo73 won't listen. 🙂
So...i'm curious about his mathematical demonstration.
If there is 2 sine with opposite phase and the same Vmax have digital median null .
What you think about seeing in the fft graph
If there is 2 sine with opposite phase and the same Vmax have digital median null .
What you think about seeing in the fft graph
The sine are at the same pulsation ...
If there is 2 sine with opposite phase and the same Vmax have digital median null .
What you think about seeing in the fft graph
How? Summed?
V1 = Vm sin (wt)
V2 = Vm sin (wt+180°)
V1+V2?
V1*V2?
What do you mean?
Mostly Clear exsample
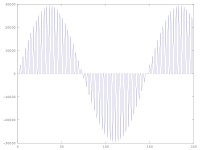
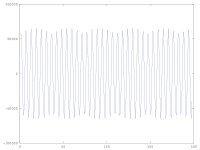
If you select the samples multiple of 3 and putting others samples to 0
see below sine0.jpeg original is only a sine at 15khz sampled at 44100
You can see one of 2 sine result of modulation
Now I'm attempt to simulate errors of settling time and amplitude .
If is right the median of the two sines become higest than 0 of ideal case ( ideal DAC)
Attachments
Is it not finished yet? seems there is something more persistent than a horse fly after all.
Get yourself one of these - Famous Rabbit-Duck Optical Illusion T-shirt - visual illusion tee shirt | eBay
If you wear this while explaining your theory, all the non-believers will vanish in a puff of logic.
Get yourself one of these - Famous Rabbit-Duck Optical Illusion T-shirt - visual illusion tee shirt | eBay
If you wear this while explaining your theory, all the non-believers will vanish in a puff of logic.
Errata corrige
I have made a mistake when i have hypnotized there is 2 sine modulation inside the
samples .
fo=15000
fc=44100
ris=2^16/2
maxi=200
maxsine=0.9
k=1:maxi
xt=floor(maxsine*sin(2*pi*(k/fc)*fo)*ris)
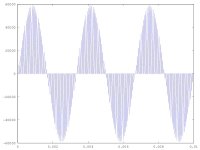
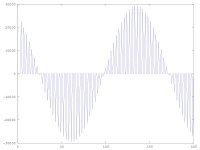
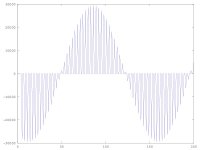
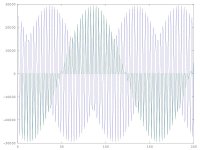
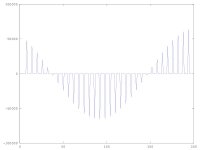
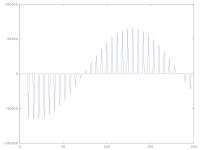
In the real there are 3 main sine modulation
xt1 made from samples multiple of 3
xt2 made from smaples multiple of 3 plus 1
xt3 made from samples multiple of 3 plus 2
Their median under time domain xm=(xt1+xt2+xt3)/3=0 (on ideal case)
See below the graphs where is on evidence xt1 or xt2 or xt3 by green pen
I have made a mistake when i have hypnotized there is 2 sine modulation inside the
samples .
fo=15000
fc=44100
ris=2^16/2
maxi=200
maxsine=0.9
k=1:maxi
xt=floor(maxsine*sin(2*pi*(k/fc)*fo)*ris)
In the real there are 3 main sine modulation
xt1 made from samples multiple of 3
xt2 made from smaples multiple of 3 plus 1
xt3 made from samples multiple of 3 plus 2
Their median under time domain xm=(xt1+xt2+xt3)/3=0 (on ideal case)
See below the graphs where is on evidence xt1 or xt2 or xt3 by green pen
Attachments
Last edited:
optical illusions
Where going the samples is not an illusion ....
Is it not finished yet? seems there is something more persistent than a horse fly after all.
Get yourself one of these - Famous Rabbit-Duck Optical Illusion T-shirt - visual illusion tee shirt | eBay
If you wear this while explaining your theory, all the non-believers will vanish in a puff of logic.
Where going the samples is not an illusion ....
![troll-ekstraenergi[1].jpg](/community/data/attachments/418/418378-76c460349b01301861c7a41fc3657a09.jpg?hash=dsRgNJsBMB)
Here's a sample you might like.
You mean.................................modulation 😀😀😀😀😀😀😀😀😀

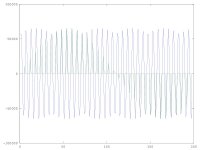
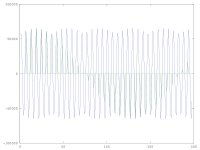
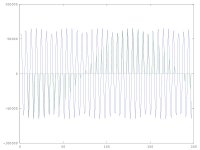
Near fc/6
on matlab
printf("Samplerate test \n")
fo=7550
fc=44100
ris=2^16
maxsamples=200
maxi=floor(maxsamples/6)*6
maxsine=1
k=1:maxi
xt=floor(maxsine*sin(2*pi*(k/fc)*fo)*ris)
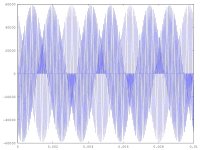
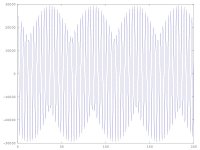
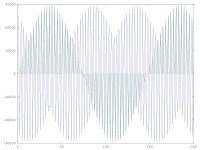
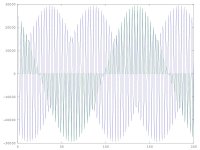
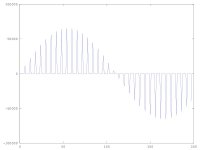
In this case the modulation is not 3-phase but 6-phase
original is
xt8
first phase
xt8-1 is composed only from samples multiple of 6
2nd phase
xt8-2 shifted by one sample from xrt8-1
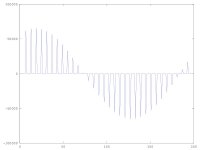
3nd phase
xt8-3 shifted by one sample from xrt8-2
4nd phase
xt8-4 shifted by one sample from xrt8-3
5nd phase
xt8-5 shifted by one sample from xrt8-4
and evidenced one by one by greeen pen
is lost one graph for 5 phase 🙁
on matlab
printf("Samplerate test \n")
fo=7550
fc=44100
ris=2^16
maxsamples=200
maxi=floor(maxsamples/6)*6
maxsine=1
k=1:maxi
xt=floor(maxsine*sin(2*pi*(k/fc)*fo)*ris)
In this case the modulation is not 3-phase but 6-phase
original is
xt8
first phase
xt8-1 is composed only from samples multiple of 6
2nd phase
xt8-2 shifted by one sample from xrt8-1
3nd phase
xt8-3 shifted by one sample from xrt8-2
4nd phase
xt8-4 shifted by one sample from xrt8-3
5nd phase
xt8-5 shifted by one sample from xrt8-4
and evidenced one by one by greeen pen
is lost one graph for 5 phase 🙁
Attachments

I agree, so when are you going to stop spreading misinformation about sampling and reconstruction?
Instead, do some reading about what a reconstruction filter does.
Instead, do some reading about what a reconstruction filter does.
- Status
- Not open for further replies.
- Home
- Member Areas
- The Lounge
- Shannon ad fc/2 tricks