You should be able to just record a silent groove and analyse in your preferred software to see the base resonances.
Andreas, you are quite right right.
The frequency axis is the spectrum of the signal modulating the 3150Hz from the LP caused by warp etc, etc., but not yet filtered by IEC386.
The vertical axis shows the rms value of the wow at a certain frequency, where 1mV corresponds to 0.1% rms.
Rms value of the modulating signal in the time plot, should be below 0.1% after IEC386 to be inaudible according to DIN and that's what most recordings meet, although more expensive turntables show figures at 0.04% or even below.
This sample isn't quite as bad as it looks and meets, when I rember correctly, something like 0.05% wow after IEC386.
Hans
The scale on mine is %, the Mober was a shade over 0.02%. I'll see if I have on for my current setup with dc tachometer and thick silicon oil in the bearing, it's a chunk of change better.
Ok,
thanks for explaining.
Frequency modulations can have different sources like speed variations or modulations due to warps, eccentricity etc
Hans,
am I correct that the speed of the TT when measuring the wow signals was a little too low as the average frequency was only 3015 Hz instead of the expected 3150Hz? This measured frequency would correspond to approx 32 rpm instead of nominal 33 1/3rpm.
You should be able to just record a silent groove and analyse in your preferred software to see the base resonances.
If measuring directly, one needs to ensure that the gain of the amplifiers and the recording measurement equipment are flat down to 1 Hz or below. If not, you already have an highpass in the measurement system that will filter away the low frequencies of interest.
This is one of the reasons why measurements for wow and flutter where made with a test record with a 3150 Hz tone. So, low frequency deviations where measured as frequency modulations of that tone.
I think the frequency modulation polars are an excellent tool. It's so easy to make out individual contributions of various parts of the turntable system.
I figured initially Chris was just after the arm cart resonance etc. A 3150Hz recording is of course much better as it can be fed through Scott's Python script and get a far more detailed analysis.
Understood. You have no data to show.
???
See Fig 7. See Fig 7. See Fig 7. See Fig 7. See Fig 7.
🙂
I figured initially Chris was just after the arm cart resonance etc. A 3150Hz recording is of course much better as it can be fed through Scott's Python script and get a far more detailed analysis.
The script JP and I did is agnostic to frequency so if you simply have spot frequencies on some tracks it will work. Hans might have used a 3K tone not many TT's are off that much. BTW the 3150Hz is special, IIRC at 33 1/3rpm there is a perfect interleave of the grooves, again we talked about this stuff in the now silent DIY test LP thread.
Last edited:
Ok,
thanks for explaining.
Frequency modulations can have different sources like speed variations or modulations due to warps, eccentricity etc
Hans,
am I correct that the speed of the TT when measuring the wow signals was a little too low as the average frequency was only 3015 Hz instead of the expected 3150Hz? This measured frequency would correspond to approx 32 rpm instead of nominal 33 1/3rpm.
It was LD’s recording that I used just to compare result.
No idea wether it was a 3150 Hz tone played at 32 rpm or a 3000 Hz tone played a little bit fast, I suspect the latter.
What I have built was just a very flexible but complex one off vehicle that can extract IM from any test tone from 1500 Hz to 5000 Hz, but is not suited for general use and takes many minutes to produce a result.
Scott on the other hand has built a very fast app in Python.
Hans
If measuring directly, one needs to ensure that the gain of the amplifiers and the recording measurement equipment are flat down to 1 Hz or below. If not, you already have an highpass in the measurement system that will filter away the low frequencies of interest.
This is one of the reasons why measurements for wow and flutter where made with a test record with a 3150 Hz tone. So, low frequency deviations where measured as frequency modulations of that tone.
That’s a nail on the head. It took me some time to figure out why on recordings from some people, the IM spectrum correlated so much better with the LF spectrum of the vertical signal than from others.
The answer was of course because of a high pass in their recording system.
Once corrected with a matching “anti high pass” filter, correlation became as expected.
Hans
???
See Fig 7. See Fig 7. See Fig 7. See Fig 7. See Fig 7.
🙂
????
Sawitsawitsawitsawit. Are you for real, are using this as a clickbait on your website? No justification why a rumble filter should have not more than 20mS group delay @20Hz. Nothing, zip, nada, jack ****.
CFA debate all over again, denying reality is a known marketing/sales tactic, and I am not the marketing/sales guy around.
Last edited:
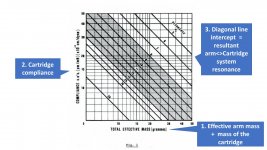
Here's a useful graph showing the resultant arm<>cart resonance given arm effective mass and cart compliance - its from SME
I looked at the Ortofon 2M series plus the SME3009 II and the resonance comes out at about 8Hz - so on the low side per the B&K app note.
Interestingly if you go onto the Rega site, they do not quote the effective arm mass for a few of their arms which I find a bit strange.
I looked at the Ortofon 2M series plus the SME3009 II and the resonance comes out at about 8Hz - so on the low side per the B&K app note.
Interestingly if you go onto the Rega site, they do not quote the effective arm mass for a few of their arms which I find a bit strange.
Attachments
Last edited:
It's the same graph as the ortofon one but plotted on log paper to give straight lines. Seriously have you only just discovered this?
For 21st century stuff have a look here Vibrational Energy of MC and MM Cartridges, Part II This is where it gets interesting. Sadly more questions asked than answered, but its a great start.
For 21st century stuff have a look here Vibrational Energy of MC and MM Cartridges, Part II This is where it gets interesting. Sadly more questions asked than answered, but its a great start.
It's the same graph as the ortofon one but plotted on log paper to give straight lines. Seriously have you only just discovered this?
For 21st century stuff have a look here Vibrational Energy of MC and MM Cartridges, Part II This is where it gets interesting. Sadly more questions asked than answered, but its a great start.
I'm reading up on this stuff @billshurv - ya gotta start somewhere . . .
????
Sawitsawitsawitsawit. Are you for real, are using this as a clickbait on your website? No justification why a rumble filter should have not more than 20mS group delay @20Hz. Nothing, zip, nada, jack ****.
CFA debate all over again, denying reality is a known marketing/sales tactic, and I am not the marketing/sales guy around.
It`s getting a little bit annoying ...
Nobody ever made a claim that GD for a rumble filter should be < 20ms. You were coming up asking for supporting facts for the 20 ms max. requirement as you could not find it in the Holman paper.
The Holman paper just says that GD of a system should be small and well below audible levels with a good margin. The 20ms @ 20 Hz in Fig 7 is simply the GD of the used filter for his experiments and a statement is made that this GD is well below the audible limits.
Nobody ever made a claim that GD for a rumble filter should be < 20ms. You were coming up asking for supporting facts for the 20 ms max. requirement as you could not find it in the Holman paper.
It's really getting annoying...
http://www.kallhovde.com/advent/phono-pre-research.pdf
The optimum filter should attenuate greatly in the difficult 7-Hz region but should not introduce audible group delay on low-frequency program material. A listening test with worst case choices of test signal and listening conditions has shown that the 20 ms worst case group delay of a three-pole complex filter is just perceptible.
The paper does not provide any evidence to support the statement in bold above. Neither does the already famous Fig. 7 which in turn shows the audible GD limit as at least an order of magnitude higher. This often quoted "20mS group delay" criteria triggered a madness of 8th order elliptical or Butterworth filters, something that is absolutely insane and useless. Why some people insist defending the indefendable is beyond my comprehension.
Capisci?
Last edited:
It's really getting annoying...
Capisci?
Please, you made me read that asymmetrical charging stuff again, the pain the pain.
I'm reading up on this stuff @billshurv - ya gotta start somewhere . . .
True, I just figured that those older than me have had vinyl setups longer than me (even with gaps in the CD era) so knew this stuff from when HFN actually put technical content in their magazines under the fine beard of John Crabbe.
Please, you made me read that asymmetrical charging stuff again, the pain the pain.
Thanks for the reminder Asymmetrical and Dust Charging

No - I'm a 'returner' but never really got involved on the mechanical stuff when I had my original T/T (a Technics DD with an SME arm and a AT14 cart and then a Sure V15. Weather they were suited to the arm I will never know. It looked ok and sounded good to my ears at the time.
Thanks for the reminder Asymmetrical and Dust Charging
I have an old electrostatic force balance electrometer in a nice wooden box. I used to come in on a winter day and touch the input and watch it take most of the day to go back to 0.
- Home
- Source & Line
- Analogue Source
- Richard Lee's Ultra low Noise MC Head Amp