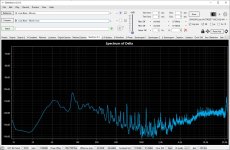
Not clear to me how DeltaWave computes some graphs. Here is a pic two original spectrums (covering a 10 second span):

As can be seen the original file has frequency peaks on average over the 10s analysis timespan. The peaks are located right around musical note frequencies (e.g. A = 440Hz). Obviously the the files are different. They appear to differ on average by 10-15dB at some frequencies over the 10s span. So why should they sound the same? 10-15dB different average power for a musical note frequency is not negligible in my book.
Where I have a question is, does anyone know how DeltaWave calculates the Matched Spectra plot? The only thing I can think of that it might doing would be to take the numerical value for each bin for each file, and adjust the bin value somehow to match the average bin value for each file. IOW, it is EQing each file bin by bin so that the FR of each bin for each file is equal to the average bin value for both files? If so, it seems crazy. Changing the FR of the files corrupts the data in them to make them look more the same!? Or what else is it doing to match FFT spectra???
Last edited:
I would guess one is the magnitude of a moving DFT of the reference and the other the magnitude of a moving DFT of the difference between the momentary values of the reference and the file to be compared to it, after shifting one waveform to get the best match. That's just a guess, though.
How can you end up with near zero difference in the frequency domain when the two files are different in the time domain and clearly different in the frequency domain? You can't change relative FR of different frequencies simply by doing the equivalent of adjusting the playback volume in the time domain.
EDIT: Not only that, but files sound plainly different. Claims of FFT spectra showing no difference, which then implies no audible difference, are absurd on the face of it. Its like someone is trying to convince you and apple and orange look so much the same you can't tell them apart, because if you change the color and of shape of each to equal the average of the two then there is no measurable difference.
EDIT: Not only that, but files sound plainly different. Claims of FFT spectra showing no difference, which then implies no audible difference, are absurd on the face of it. Its like someone is trying to convince you and apple and orange look so much the same you can't tell them apart, because if you change the color and of shape of each to equal the average of the two then there is no measurable difference.
Last edited:
Looking a bit better, my reply of post #3123 is clearly wrong. I haven't a clue what the graphs in post #3122 are supposed to be.
There are two files named in the upper left corner of the pic. They are assigned colors for each, blue and white. The upper right shows the section of the files to be compared, in this case starting at 10s from the beginning of the files and ending at 20s into the files. There are FFT settings under the gear tooth icon.
So we have two FFTs of two recordings, an original CD rip, and another file made from the same CD rip but passed through PCM2DSD -> DAC -> ADC -> File.
If the processing of the second file was perfect then the two spectra should look identical, but they don't. So far so good.
The confusion arises when we click on the next tab that says Matched Spectra, and it shows the the spectra for the two files are now virtually identical. The question is what processing made them identical in the frequency domain and does such processing represent a modification of the sound of the files (at least if actually applied to the files)? IMHO, it looks a lot like a multiband FFT EQ has been applied to each file 10s segment to make its adjusted FR equal to the average of the FR's of the original two files? Thus they have been "matched" in the frequency domain. But did I guess the actual process used? Also, if played back with the adjusted FR, do each of the file segments sound different than they originally did? I think they pretty much would have to sound different from having been EQ'ed.
Matching in DeltaWave involves complex fitting of e.g. timings, phase and gain since there are always gain differences, delays etc. You are looking at information before any matching was done. Do you see any such differences in matched spectra?
They should sound the same if you match the gain. But this was not about comparing the PCM2DSD recordings against the original but comparing the 2 PCM2DSD recordings against each other.So why should they sound the same?
The recordings and the matching done in DeltaWave have nothing to do with each other. DeltaWave does not know how the recordings were made. It is possible to make the recording from DeltaWave but that is a separate process done before matching.I think they pretty much have to sound different from having been EQ'ed.
We should get to that next. First I'm trying to understand the calculations used to produce the graphs. Otherwise I don't know what is being analyzed. Right now it kind of looks like DeltaWave is doing a lot of analysis to show that is matching algorithms produce very close matches. But matching what? Is DeltaWave adjusting FR of each original spectrum to make it match an average spectrum? Then DeltaWave lets the user see that is got a very small error in its matching process. But it makes no sense for us to compare recordings EQed by DeltaWave so they sound more the same over a selected time segment. Doesn't matter if it can be done to very high accuracy. The DeltaWave process would amount to a corruption of the files for our purposes here. Maybe okay for different uses of DeltaWave though?...comparing the 2 PCM2DSD recordings against each other.
Last edited:
Right. I was just trying to clarify for Marcel what we were looking at.DeltaWave does not know how the recordings were made.
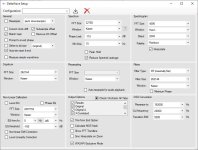
My understanding is that basic matching (as was done here) involves linear operations such as fitting based on gain and offset so no EQs involved and in this case not even clock drift correction as clocks were synchronized. But it is possible to do non-linear EQs if the matching otherwise is poor (see attachment of DeltaWave setup).We should get to that next. First I'm trying to understand the calculations used to produce the graphs. Otherwise I don't know what is being analyzed. Right now it kind of looks like DeltaWave is doing a lot of analysis to show that is matching algorithms produce very close matches. But matching what? Are they adjusting FR to make it match on average, and then you can see that is got a very small error in its matching process. But it makes no sense for use to compare EQed recordings and show they they can be EQ'ed the same to high accuracy. That's would amount to a corruption of the files for our purposes here. Maybe okay for different uses of DeltaWave though?
Attachments
Gain and offset in the time domain is one thing. Gain and offset in the frequency domain is a very different type of operation when viewed in the time domain. In the time domain it amounts to EQ, and or multiband dynamics processing.
EDIT: Of course EQ is a linear operation because it doesn't produce new frequencies. However it is a linear distortion; it can be audible for some people for changes as little as .01dB or less, according to Paul Frindle as described in his AES paper.
EDIT: Of course EQ is a linear operation because it doesn't produce new frequencies. However it is a linear distortion; it can be audible for some people for changes as little as .01dB or less, according to Paul Frindle as described in his AES paper.
Last edited:
With the settings shown in my previous post the matching does not use EQ.
I think you are looking at this from a wrong angle. As I said before this is a tool mainly for assessing implementation quality. If matching is poor without non-linear operations then the implementation is lacking. In a scenario like this where only a single variable was changed DeltaWave can also be used to analyze differences. So for this exercise you should be more interested in comparing the recordings made with PCM2DSD against each other in DeltaWave.
I think you are looking at this from a wrong angle. As I said before this is a tool mainly for assessing implementation quality. If matching is poor without non-linear operations then the implementation is lacking. In a scenario like this where only a single variable was changed DeltaWave can also be used to analyze differences. So for this exercise you should be more interested in comparing the recordings made with PCM2DSD against each other in DeltaWave.
Last edited:
Then how can it match FFT spectra that are so different from each other? There is not one simple gain that will do it for every bin. It would have to linearly adjusted bin by bin to match the average spectrum. That is EQ in the time domain.
Why do you assume the matching is done for FFT spectra? The cross-correlation is done on waveforms (i.e. sample data).
I tried to explain in way that seems sensible to me. Maybe someone else here could chime in on it?
For everyone's information, I just did some noise voltage measurements on a BC640 and BC639 of whatever brand the local parts store (Display Elektronica, previously known as Eurosound) happened to have in stock. These are supposed to be the single TO-92 versions of the dual transistors used in the bandgap.
It looks like the PNP has a base resistance of about 3.5 ohm and the NPN about 6.1 ohm. Very low values, making them quite suitable for the input stage of a discrete version of the combined LC and MFB filter (as well as for many other applications).
It looks like the PNP has a base resistance of about 3.5 ohm and the NPN about 6.1 ohm. Very low values, making them quite suitable for the input stage of a discrete version of the combined LC and MFB filter (as well as for many other applications).
If dac & adc are well implemented and synchronized matching is straightforward as only gain and offset need to adjusted. Spectra and other charts are based on matched waveforms. Of course well matched waveforms result in well matched spectra. However no matching of FFT spectra is done as is evident from the various screenshots in ASR DeltaWave. E.g. https://www.audiosciencereview.com/forum/index.php?attachments/1689022602024-png.298226/.I tried to explain in way that seems sensible to me. Maybe someone else here could chime in on it?
To get most out of this PCM2DSD/DeltaWave exercise I suggest the following:
Run Foobar ABX on the 2 recordings. If the ABX result is statistically significant (95% or p-value < 0.05, 8 correct out of 10 ), post the giveaway locations so that others can listen to them as well. Then we can study those locations with DeltaWave to find out what is happening there. If DeltaWave does not show any differences at those locations it probably is not suited for this type of analysis.
This is not only for Markw4. Anybody lurking here can have a go at this.
- Home
- Source & Line
- Digital Line Level
- Return-to-zero shift register FIRDAC