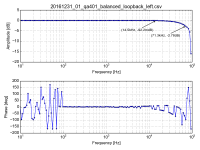
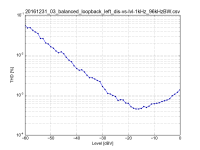
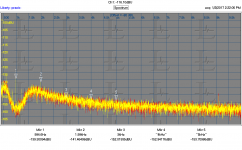
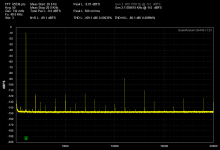
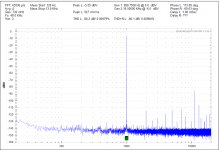
This morning I had a look at the overall Frequency Response in 192kHz mode, Loopback via two cheap 1.5m RG58 BNC cables and the Right Channel Inputs shorted to Ground.
Level was -10dBV unbalanced, resulting in -4dBV in balanced mode. For plotting the amplitude was normalized to 1kHz. For reference, I added some annotations for -0.1dBr (rel. 1KHz) and -3dBr (rel. 1kHz), since these figures have not been published before. Please note, that these values represent the last sampled value before the -3dBr limit. For more precision the frequency resolution should be increased. In this case the frequency resolution was 10steps/octave.
BTW: the .csv-formatting given by QuantAsylum is absolutely horrible. In my opinion this is as far away from the common csv-standard as one could possibly get. 😉
Attachments
Last edited:
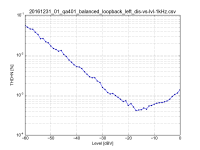
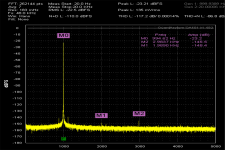
The sweet spot for distortion seems to be -17dBV for my unit...
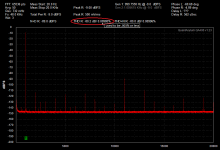
The distortion figure over frequency was captured between 10Hz and 100kHz but values below 20Hz and above 1.5kHz were not valid (either zero or much much greater than one).
(fs=192kHz, balanced loopback and right input channel grounded with 0Ohm, as described above).
The distortion figure over frequency was captured between 10Hz and 100kHz but values below 20Hz and above 1.5kHz were not valid (either zero or much much greater than one).
(fs=192kHz, balanced loopback and right input channel grounded with 0Ohm, as described above).
Attachments

Oh, yes you are right. The A-weighting was activated by accident. Don't know why, never used it till now, but never mind.
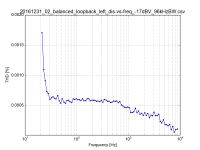
Attached, the last two plots without A-Weighting. Further, one must keep in mind, that all distortion figures presented were calculated by the QA401 on the basis of a 20kHz measurement-Bandwidth.
Attached, the last two plots without A-Weighting. Further, one must keep in mind, that all distortion figures presented were calculated by the QA401 on the basis of a 20kHz measurement-Bandwidth.
Last edited:
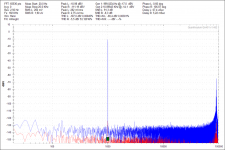
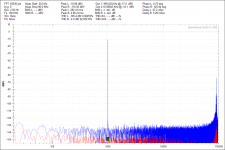
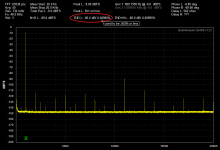
I just realized, that the plots above are wrong. The stepped response plugin auf the QA-Software returns the raw THD value (not THD+N, wrong assumption of mine) with the before defined calculation bandwidth. This time no A-weighting present.
On the last plot it is clearly visible, that the 96kHz Bandwidth is limiting the number of harmonics relevant for THD calculation for a fundamental above 6 or 7kHz.
On the last plot it is clearly visible, that the 96kHz Bandwidth is limiting the number of harmonics relevant for THD calculation for a fundamental above 6 or 7kHz.
Attachments
when I turn on the 401's generator output at 1v and 1KHz, I read on my VP7722A analyzer, a THD of -96dB or about .0016%. It is mostly 2H. This is backed up with AP analyzer also:

The THD is -91dB at 100Hz and get better as freq increases.... 1KHz = -96dB, 5KHz = -100dB; 10KHz = -100dB and then gets worse at 20KHz = -85dB
THx-RNMarsh
The THD is -91dB at 100Hz and get better as freq increases.... 1KHz = -96dB, 5KHz = -100dB; 10KHz = -100dB and then gets worse at 20KHz = -85dB
THx-RNMarsh
Last edited:
What level are you set to? Can you look at it differentially? The AK4490 usually measures better than that. 0 dB is not goot. -3 to -6 should be a lot better.
RNMarsh - related to 1audio's question, just to make sure I'm understanding the test setup, is this the generator portion (only) of the QA401 going to either the VP7722A or measurement or to the AP for measurement, but none of this is using the analysis portion of the QA401? So essentially a THD test of the QA401's generator using external (better!) THD testers?
I agree with 1audio on the analysis side of the QA401. I think I've either read in their materials, or some email back and forth, that -6dB is the sweet spot for low THD.
Thanks for the measurements! Very interesting.
I agree with 1audio on the analysis side of the QA401. I think I've either read in their materials, or some email back and forth, that -6dB is the sweet spot for low THD.
Thanks for the measurements! Very interesting.
Last edited:
RNMarsh - related to 1audio's question, just to make sure I'm understanding the test setup, is this the generator portion (only) of the QA401 going to either the VP7722A or measurement or to the AP for measurement, but none of this is using the analysis portion of the QA401? So essentially a THD test of the QA401's generator using external (better!) THD testers?
I agree with 1audio on the analysis side of the QA401. I think I've either read in their materials, or some email back and forth, that -6dB is the sweet spot for low THD.
Thanks for the measurements! Very interesting.
It may not be straight forward to connect the QA gen to the AP analyzer as the QA gen output is pulsed vs continuous.
QA publishes that -16 dBFS is the sweet spot for lowest generator distortion.
DT
, is this the generator portion (only) of the QA401 going to either the VP7722A or measurement or to the AP for measurement, but none of this is using the analysis portion of the QA401? So essentially a THD test of the QA401's generator using external (better!) THD testers?
.
yes, that is correct. Not using the 401 analyzer to measure the 401 generator.
THx-RNMarsh
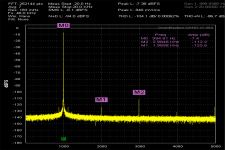
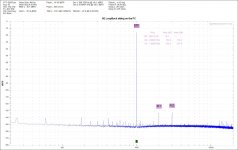
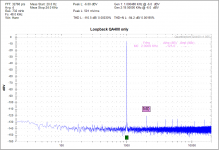
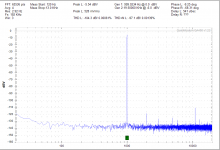
Actually the sweet spot seems to be around -15 to -18 dB on the ADC. I made some measurements using a Victor oscillator. First the QA410 + Shibasoku 725 from the QA410, The same from the 725 and finally without the QA401 connected.
This highlights two issues that are important on these very low distortion measurements. You can see that the QA401 is introduucing some distortion when connected to the output of the victor oscillator. The oscillator is on battery power and its 600 OHms out. On the 725 the 2nd harmonic is -141 and 3rd is -152. When connected to the QA401 2nd goes up to -126 while the 3rd stays around -152. Looking from the QA401 side 2nd is -123 and 3rd is -112.
I have seen this issue of the input causing distortion at a very low level before. I'm not sure why since there are many possible causes. A low source impedance does mitigate this some but it also means you can't take any of these numbers as absolute. You need to do a lot of checking and homework. Also noise coupling is a real PITA. you need to move bits around the bench and many grounding options checking for extraneous noises etc to find an optimum
Finally, the lowest distortion I got from the QA401 was at 135 mV in. Last picture.
Attachments
Don't discount having to turn off some lights and / or other test equipment for measurements this far down. It is possible that you might even need a metal box with lead feedthroughs as used in professional laboratories. You are measuring "way down" into their territory, so you may need to do some of the same things they do.
Working in a basement is a plus here.
-Chris
Working in a basement is a plus here.
-Chris
Hello,
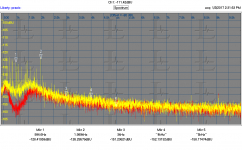
I believe that there is some confusion going on here. We should be comparing dB’s to something other than dBFS. As in use dBr comparing harmonics to the fundamental peak or dBV comparing harmonics to 1 volt.
Saying that something is -141dB without a reference does not have much meaning. The above plots are missing the dBr part of the marker descriptions.
DT
Attachments
It is nice that the QA provides relative measurements. I did not know it had this option.
I agree with what you are saying about the scales. People not referencing their fundamental peak (if not at 0) to harmonics can calculate incorrectly. My biggest gripe with ARTA is the lack of a relative scale. I have been using HpW-Works recently and the scale choices are abundant. dBr (relative to fundamental peak) is an option that I have set for all my plots.
I agree with what you are saying about the scales. People not referencing their fundamental peak (if not at 0) to harmonics can calculate incorrectly. My biggest gripe with ARTA is the lack of a relative scale. I have been using HpW-Works recently and the scale choices are abundant. dBr (relative to fundamental peak) is an option that I have set for all my plots.
On the two Praxis plots the levels are referenced to the fundamentals. On the QA401 the THD in dB is the relevant number to look at. Praxis has more flexible scaling options but doesn't automatically mark the harmonics.
My victor oscillator drifts a bit. It was 997 Hz when I got it. Now, on a cold start is 992 Hz and after 10 minutes or so it's 994 Hz. Victor uses very good parts but this illustrates the reality of precision parts, they do change with time and temperature. I have some .1% 1/4W resistors harvested from an instrument. I'll check to see what they are now. After 20 years they will have drifted.
My victor oscillator drifts a bit. It was 997 Hz when I got it. Now, on a cold start is 992 Hz and after 10 minutes or so it's 994 Hz. Victor uses very good parts but this illustrates the reality of precision parts, they do change with time and temperature. I have some .1% 1/4W resistors harvested from an instrument. I'll check to see what they are now. After 20 years they will have drifted.
Hi Demain,
I used to repair and certify instruments, and your postulation is correct. Once you're down to those levels of error, it doesn't take much for that part to be out of tolerance. I wonder, how is the resistance vs voltage on those? You can run into all kinds of problems with stable quality parts. Temperature is another thing all together.
-Chris
D
Deleted member 148505
Hi all,
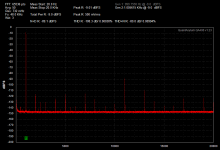
Has anyone experiences large pop when stopping the fixed tone generator of QA400? It's random and not always happening... I'm not hearing it because i'm using a dummy load but sometimes the relay is triggered or short circuit protect is activating on some amps after stopping it.
It is not happening when i'm using external sine wave generator. But I like the QA400's generator because it is pulsed, not 100% duty cycle and not stressing the amps. Also it will be hassle if I'm using different generators for calibrating the input voltage for my interface.
Attached screenshot for the fixed tone generator
Thanks,
Lester
-----------------
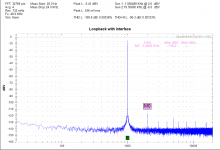
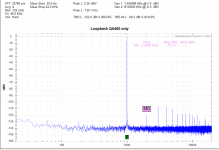
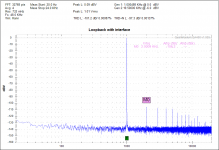
BTW I also created an interface using THAT1206 and THAT1646 inspired from this thread. It has 6db/20db attenuator before THAT1206 and, at its output it has a 10k pot for fine tuning the amplitude and then fed to non inverting buffer + inverting buffer, so you can set the final output below 1Vrms. It has THD penalty and final output is inverted, but it is usable up to 100V rms signal (if ic supply is +/-17vdc).
Attached loopback shots
Has anyone experiences large pop when stopping the fixed tone generator of QA400? It's random and not always happening... I'm not hearing it because i'm using a dummy load but sometimes the relay is triggered or short circuit protect is activating on some amps after stopping it.
It is not happening when i'm using external sine wave generator. But I like the QA400's generator because it is pulsed, not 100% duty cycle and not stressing the amps. Also it will be hassle if I'm using different generators for calibrating the input voltage for my interface.
Attached screenshot for the fixed tone generator
Thanks,
Lester
-----------------
BTW I also created an interface using THAT1206 and THAT1646 inspired from this thread. It has 6db/20db attenuator before THAT1206 and, at its output it has a 10k pot for fine tuning the amplitude and then fed to non inverting buffer + inverting buffer, so you can set the final output below 1Vrms. It has THD penalty and final output is inverted, but it is usable up to 100V rms signal (if ic supply is +/-17vdc).
Attached loopback shots
Attachments

Last edited by a moderator:
unexplained increase in THD on Left Output (QA400)
Recently I discovered that my QA400's left output is exhibiting some strange increase in THD.
When I do a loopback test with the Gen 1 (left channel) as output, THD measures about 3x more than what it should (used to be .003% or less - now is .009%). This is corroborated on both the left and right inputs. Fortunately the right output (Gen 2) is functioning normally.
I've attached pics showing the increased THD from the left output (Gen 1) in comparison with the THD from the right channel output (Gen 2).
I guess I'm surprised or puzzled because it's an output. Any thoughts on this? Should I try replacing the output op amp?
Attachments
-
 QA400 Right Channel Output (Right Channel Input) THD.png29.2 KB · Views: 141
 -
 QA400 Right Channel Output (Left Channel Input) THD.png28.9 KB · Views: 133
 -
 QA400 Left Channel Output (Right Channel Input) THD_annotated.png37.7 KB · Views: 143
 -
 QA400 Left Channel Output (Left Channel Input) THD_annotated.png37.6 KB · Views: 156
D
Deleted member 148505
Recently I discovered that my QA400's left output is exhibiting some strange increase in THD.
When I do a loopback test with the Gen 1 (left channel) as output, THD measures about 3x more than what it should (used to be .003% or less - now is .009%). This is corroborated on both the left and right inputs. Fortunately the right output (Gen 2) is functioning normally.
I've attached pics showing the increased THD from the left output (Gen 1) in comparison with the THD from the right channel output (Gen 2).
I guess I'm surprised or puzzled because it's an output. Any thoughts on this? Should I try replacing the output op amp?
It's because of the new software version V1.23. Try 192ksps sample rate on V1.23, it has better measurements..
But V1.055 still has better measurements on loopback mode.
Attachments
- Home
- Design & Build
- Equipment & Tools
- QuantAsylum QA400 and QA401