Yes, the spacing front and rear is symmetric.
The result of all asymmetric constructions of L shape aluminium strips mounted in rubbers, with the panels mounted on the strips, thickness of the panel side mounting rounds, give that the diaphragm is exactly in the middle between the dust covers. This goes for 63 model at least. Haven’t checked later models yet.
The result of all asymmetric constructions of L shape aluminium strips mounted in rubbers, with the panels mounted on the strips, thickness of the panel side mounting rounds, give that the diaphragm is exactly in the middle between the dust covers. This goes for 63 model at least. Haven’t checked later models yet.
Just checked for the 988-989, the front-rear dust panel spacing is symmetrical here too.
Haven't got an open 2805 or 2812 available at the moment to check.
But in general it looks like all are symmetrical.
Haven't got an open 2805 or 2812 available at the moment to check.
But in general it looks like all are symmetrical.
I just did some 2um mylar dust covers and I'm no stranger to heat shrinking PET dust covers and those 2um covers were a complete nightmare. It took finesse to get the covers wrinkle free and not looking like swiss cheese.I guess you mean ½ mil = 12 micron, not ½ micron. Can't imagine what it is to work with 0,5 micron, as 3 micron is already a PITA to work with.
Sheldon

The .5 uM film is really hard to use. Any dust on a flat surge under it will puncture it. And even a little too much heat and it melts away. But thats all history. There are properties to the films that will affect things, like "tenzilation?" and other mechanical processing. I suspecy the sound made by crushing a ball of film with be an indicator of its sonic impact. It the past "credit card" was used to describe a type of coloration.
Sorry to come to the discussion so late....A few years ago bolserst and I spent sometime developing a way of modelling the whole stator assembly using LTspice, including the membrane, stators and dust cloths. An isolated mylar sheet behaves as an acoustic reflector resulting in first-order low-pass response with a cutoff frequency approximately equal to 96 kHz divided by the thickness in microns so there is no need for anything thinner than about 3.5 um.
For further information PM me so we can exchange email addresses and I can send a copy of the paper.
For further information PM me so we can exchange email addresses and I can send a copy of the paper.
I am still working on a robust test setup for my comparative measurements.
For single reflection and transmission measurements I will resort to a much thinner and mobile frame, to be placed behind or in front of the static microphone. So the microphone will always pick up the same rubbish from the room, thus being able to be subtracted.
I also think having found a method to hopefully best possibly display the reflection effects. First measure all three variants, direct sound, transmission and reflection:


In real-life and as expected, things are more complex.


Upper graph shows the impulse responses of the Mylar 4.2um film. The film is tensioned to a f_res = 11Hz within a thin frame of 60cm x 80cm. The X-axis of the time domain graph is scaled such as to display 0.5ms before the initial impulse and 10ms after the impulse.
blue: Transmission. So loudspeaker - film - microphone.
grey: Reflection. So loudspeaker - microphone - film - reflection from the film
black: Direct sound as a reference. So loudspeaker - microphone.
Lower graph shows the processed data in frequency domain. All three samples were first converted to LinPhase, then windowed to a finite window of +-10ms. The frequency response of the direct sound was inverted and then convolved with the responses of the transmission and the reflection. This eliminates the room reflections and also all the speaker non-linearities. No additional smoothing methods has been included in the processing. The resulting response then shows the corrected responses of the transmitted and the reflected sound.
red: Transmission
green: Reflection.
For the transmission, we get what whe expect. Frequency response rolls off at higher frequencies. But then, there are two strange peaks at approx. 2.8kz and 3.8kHz. Interestingly they correspond to dips in the reflection curve.
For the reflection, there is a surprize when comparing with the theoretical response: There is an increase in the expected response with increasing frequencies. At frequencies < 1kHz we see no comb filtering pattern at all. In the range between 1kHz and approx. 8kHz there is a comb filtering pattern with growing amplitude, but the spacings of the dips and the peaks do not correspond to the theoretical model. Above 10kHz, everything seems fine with a still growing amplitude.

This last graph shows the superposition of theory (black) and the measurement (green). Note that in the measurement the relation of direct sound - to - reflection was quite higher with approx. 7dB than in the theoretical model (12dB). This is why at higher frequencies the amplitude of the green curve (measurement) is higher than the amplitude of the black one.
My interpretation so far: Two mechanisms might account for this result. At low frequencies the film is compliant enough not to produce notable reflections. The higher the frequency, the less the film gets compliant, and the more the film behaves like in the theoretical model: Reflection gets stronger with increasing frequency. Anothe thing: In the intermediate range around 1kHz ... 10kHz the film might behave inconsistently due to inner damping and local resonances effects.
???
Maybe this overall approach could allow for a discriminative test along different films: Simply to look how the increase of the resonance response behaves. The lower the final amplitude, the better. And also the more regular the combing, the better.
???
My guess would be it is diffraction from the frame that holds the diaphragm.
When you took the reference impulse measurement, did you do it with an empty frame in place?
You would need to do that to include the diffraction in the reference signal
For single reflection and transmission measurements I will resort to a much thinner and mobile frame, to be placed behind or in front of the static microphone. So the microphone will always pick up the same rubbish from the room, thus being able to be subtracted.
I also think having found a method to hopefully best possibly display the reflection effects. First measure all three variants, direct sound, transmission and reflection:
- Loudspeaker - microphone (distance 2m, SR 192kHz, sinesweep 100 ... 25kHz, duration 10s)
- Loudspeaker - film - microphone (film placed 86mm in front of the microphone)
- Loudspeaker - microphone - film (film placed 172mm behind the microphone)
In real-life and as expected, things are more complex.
Upper graph shows the impulse responses of the Mylar 4.2um film. The film is tensioned to a f_res = 11Hz within a thin frame of 60cm x 80cm. The X-axis of the time domain graph is scaled such as to display 0.5ms before the initial impulse and 10ms after the impulse.
blue: Transmission. So loudspeaker - film - microphone.
grey: Reflection. So loudspeaker - microphone - film - reflection from the film
black: Direct sound as a reference. So loudspeaker - microphone.
Lower graph shows the processed data in frequency domain. All three samples were first converted to LinPhase, then windowed to a finite window of +-10ms. The frequency response of the direct sound was inverted and then convolved with the responses of the transmission and the reflection. This eliminates the room reflections and also all the speaker non-linearities. No additional smoothing methods has been included in the processing. The resulting response then shows the corrected responses of the transmitted and the reflected sound.
red: Transmission
green: Reflection.
For the transmission, we get what whe expect. Frequency response rolls off at higher frequencies. But then, there are two strange peaks at approx. 2.8kz and 3.8kHz. Interestingly they correspond to dips in the reflection curve.
For the reflection, there is a surprize when comparing with the theoretical response: There is an increase in the expected response with increasing frequencies. At frequencies < 1kHz we see no comb filtering pattern at all. In the range between 1kHz and approx. 8kHz there is a comb filtering pattern with growing amplitude, but the spacings of the dips and the peaks do not correspond to the theoretical model. Above 10kHz, everything seems fine with a still growing amplitude.
This last graph shows the superposition of theory (black) and the measurement (green). Note that in the measurement the relation of direct sound - to - reflection was quite higher with approx. 7dB than in the theoretical model (12dB). This is why at higher frequencies the amplitude of the green curve (measurement) is higher than the amplitude of the black one.
My interpretation so far: Two mechanisms might account for this result. At low frequencies the film is compliant enough not to produce notable reflections. The higher the frequency, the less the film gets compliant, and the more the film behaves like in the theoretical model: Reflection gets stronger with increasing frequency. Anothe thing: In the intermediate range around 1kHz ... 10kHz the film might behave inconsistently due to inner damping and local resonances effects.
???
Maybe this overall approach could allow for a discriminative test along different films: Simply to look how the increase of the resonance response behaves. The lower the final amplitude, the better. And also the more regular the combing, the better.
???
Attachments
Last edited:
Addendum:
There was a 3 samples mismatch between the real-worl measurement (189 @ 192 kHz)) and the theoretical model (192 @ 192kHz) in the last graph of the prior post. This bias blurred the comparing.
Here is the graph once again. It's adapted for the same sample delay (189 @ 192 kHz). The X-axis is a bit zoomed. Also the model's reflection pulse has been adapted to better match the amplitude of the reflection pulse of the measurement.
Black is the model, Green the measurement.
Could the difference be explained by internal damping of the foil at lower frequencies, which is not accounted for in the theoretical model?
Jan
Jan
It obviously must be a (combined?) mechanism that makes the reflections weaker with decreasing frequency.
If you simulate the delayed impulse from the reflection not as a dirac function, but rather as a sloping function (brown, 5dB/Oct), then you get a nice and near approximation of what I measured on this 4.2um Mylar film above 8kHz.
Nota bene the persistent irregularities below 8kHz which still call for further understanding and explanation.
Green: Measurement
Brown: Synthesized function of a 5dB sloping reflection, 0dB @20kHz, linear above 25kHz
Black: Synthesized response of initial direct pulse plus the 1ms delayed, sloping reflection function
Last edited:
But now below 5kHz the reflections are double frequency.
Doesn't seem right.
Intersting investigation though. Fascinating.
Jan
Doesn't seem right.
Intersting investigation though. Fascinating.
Jan
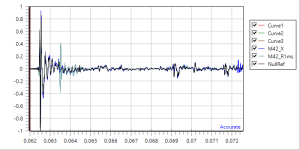
It seems that displaying an impulse as a burst decay spectrogram might be an illustrative way to assess the transfer and the reflection behavior of a film.
First, as a process control, the following graph show the burst decay spectrogram of the processed null/ref signal (measured from speaker to mic without any film). It should show no decay artefacts at all, which is the case. So the processing of the raw measured impulses seems valid:

The next graph shows the synthetized comb filtering pattern which has been published before in post 70:

Then, next is the burst decay of the real-world measured and processed impulse from the reflection response of Mylar 4.2um:

Finally the burst decay of the processed impulse from the transmission measurement of the Mylar 4.2um film:

So we can expect that this kind of spectrum analysis will allow yet another view on the reflection and transmission properties of the different film test candidates: The less clutter in the burst decay of the transmission and reflection impulse, the more transparent a film will behave acoustically.
Same pulse processing might be helpful when tweaking a given film dust protection in search of the best possible compromize (tensioning, damping and the like).
Thank you REW!
First, as a process control, the following graph show the burst decay spectrogram of the processed null/ref signal (measured from speaker to mic without any film). It should show no decay artefacts at all, which is the case. So the processing of the raw measured impulses seems valid:
The next graph shows the synthetized comb filtering pattern which has been published before in post 70:
Then, next is the burst decay of the real-world measured and processed impulse from the reflection response of Mylar 4.2um:
Finally the burst decay of the processed impulse from the transmission measurement of the Mylar 4.2um film:
So we can expect that this kind of spectrum analysis will allow yet another view on the reflection and transmission properties of the different film test candidates: The less clutter in the burst decay of the transmission and reflection impulse, the more transparent a film will behave acoustically.
Same pulse processing might be helpful when tweaking a given film dust protection in search of the best possible compromize (tensioning, damping and the like).
Thank you REW!
Last edited:
It is an illusion of the LOG frequency scale.But now below 5kHz the reflections are double frequency.
Doesn't seem right.
With summation of a delayed reflection, you will see the peaks and valleys equally spaced on a Linear frequency scale.

Yes, it is the mass of the diaphragm forming 1st order filter with the acoustic impedance of the air, which is almost entirely resistive at high frequencies.It obviously must be a (combined?) mechanism that makes the reflections weaker with decreasing frequency.
You might revisit Post#44.
Here is an overlay comparison using the AES modeling method for your measurement setup.


Indeed it is. It will highlight if any peaks/dips in the response are due to reflections. It also shows you reflections in your measurement setup.It seems that displaying an impulse as a burst decay spectrogram might be an illustrative way to assess the transfer and the reflection behavior of a film
My preference is the use of the Spectrogram processing available in REW as it not only highlights the reflections, it shows you the timing of the reflection relative to first arrival.
Your example would look something like this.

I need to process this*. Both curves are on identical scales.It is an illusion of the LOG frequency scale.
With summation of a delayed reflection, you will see the peaks and valleys equally spaced on a Linear frequency scale.
Jan
*'I don't get it' 😎
- Home
- Loudspeakers
- Planars & Exotics
- QUAD ESL63 dust protection comparative testing