 Some off-topic posts moved to here - https://www.diyaudio.com/community/threads/detailed-operation-of-the-quad-esl63.428707/post-8031720
..some removed.
Lets assume that Mylar is somewhat reflective because this is what your measurements suggests. How would this translate to an ESL? When the dustcover is very close to the transducer then for most frequencies there is too little time delay for the reflection to mess up. It is like driving a single piece of Mylar with increased mass. So while the measurements show reflections the effect may be less worse in reality. Depending on exact geometry. There is high frequency hash in the decay plot of the quad63. Maybe part of it is due to reflection, I dont know, only by measurig a naked quad versus dustcovered quad we could see. So it is useful to discover that the Mylar does reflect, something I didnt expect.
As it has been stated elsewhere that heavier Mylar tends to roll off high frequency response earlier. So it would be great to generate a frequency response.
As it has been stated elsewhere that heavier Mylar tends to roll off high frequency response earlier. So it would be great to generate a frequency response.
Thinking.... Taking a dome tweeter and running a square wave. Measure with and without mylar.
Use Audacity to subtract one measurement from the other. This will give a delta signal that can be analyzed, and can be listenable.
Use Audacity to subtract one measurement from the other. This will give a delta signal that can be analyzed, and can be listenable.
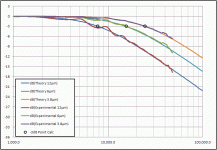
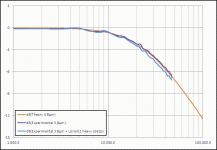
This is a great technique. I have used it in the past to measure the transmission of sound thru diaphragms. You can also use it to evaluate the mass of different conductive coatings. For my work I used an XT25 tweeter since it has flat response from 1kHz extending out to 40kHz. I measured once without a diaphragm, and then normalized all subsequent measurements with diaphragms in place by this reference response. Transmission of sound thru a diaphragm results in a 1st order LP response with the roll-off point falling with increased diaphragm mass/thickness.
https://www.diyaudio.com/community/threads/electrostatic-speakers-as-microphones.231062/post-3427260
https://www.diyaudio.com/community/threads/david-lucas-esl.186840/post-3610816
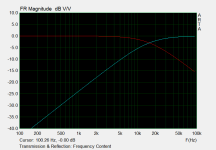
Intuitively one would think that whatever gets reflected back must be the leftovers from what was transmitted thru, and indeed this is the case. The frequency content of the reflection shows a 1st order HP response with roll-off point matching the transmission response. It is a little more difficult to measure, but can be done by selective windowing of the measured impulse response to capture just the reflection of interest. All of this HF behavior and much more complicated combinations with stators, damping mesh, etc can easily be modeled using the techniques published in this AES paper:
“Acoustic Transparency of Electrostatic Loudspeaker Assemblies”, White/Bolser 2017 AES
DiyAudio Thread: https://www.diyaudio.com/community/...-on-hf-esl-phenomena-imho.321111/post-5396518
Available from: https://aes2.org/publications/elibrary-page/?id=18782
Available from: https://www.researchgate.net/public...rency_of_Electrostatic_Loudspeaker_Assemblies
To illustrate transmission and reflection from a diaphragm, lets take a look at a slightly simplified measurement setup, starting with what Daihedz has been using in Post#11, but remove the reflector plate.
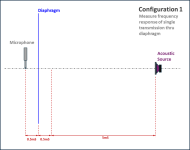
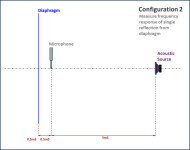
Here are the resulting theoretical frequency responses for transmission and reflection for a 6µm diaphragm analyzed at 192kHz.
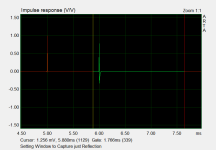
For the reflection case, here is the impulse response with windowing applied to capture just the reflection.
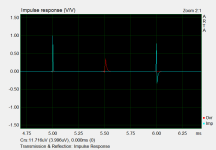
To compare the size/shape of the reflection and transmission impulses, I shifted the transmission impulse in time by 0.5mS for a better overlay with the reflection. You can see that indeed the reflection and transmission look to sum to the impulse test signal. Also note that the reflection looks to have higher magnitude than the transmission, but this is not the case as can easily be seen from the frequency response comparison. You have to be careful when trying to make judgments based on looking just at the impulse response peak magnitude…especially if using 48kHz sampling rate where the exact peak may not be captured in the impulse response. Note that this does not affect the frequency response, it just moves the energy elsewhere in the impulse pre/post ringing (ie Gibbes effect).


https://www.diyaudio.com/community/threads/electrostatic-speakers-as-microphones.231062/post-3427260
https://www.diyaudio.com/community/threads/david-lucas-esl.186840/post-3610816
Intuitively one would think that whatever gets reflected back must be the leftovers from what was transmitted thru, and indeed this is the case. The frequency content of the reflection shows a 1st order HP response with roll-off point matching the transmission response. It is a little more difficult to measure, but can be done by selective windowing of the measured impulse response to capture just the reflection of interest. All of this HF behavior and much more complicated combinations with stators, damping mesh, etc can easily be modeled using the techniques published in this AES paper:
“Acoustic Transparency of Electrostatic Loudspeaker Assemblies”, White/Bolser 2017 AES
DiyAudio Thread: https://www.diyaudio.com/community/...-on-hf-esl-phenomena-imho.321111/post-5396518
Available from: https://aes2.org/publications/elibrary-page/?id=18782
Available from: https://www.researchgate.net/public...rency_of_Electrostatic_Loudspeaker_Assemblies
To illustrate transmission and reflection from a diaphragm, lets take a look at a slightly simplified measurement setup, starting with what Daihedz has been using in Post#11, but remove the reflector plate.


Here are the resulting theoretical frequency responses for transmission and reflection for a 6µm diaphragm analyzed at 192kHz.

For the reflection case, here is the impulse response with windowing applied to capture just the reflection.

To compare the size/shape of the reflection and transmission impulses, I shifted the transmission impulse in time by 0.5mS for a better overlay with the reflection. You can see that indeed the reflection and transmission look to sum to the impulse test signal. Also note that the reflection looks to have higher magnitude than the transmission, but this is not the case as can easily be seen from the frequency response comparison. You have to be careful when trying to make judgments based on looking just at the impulse response peak magnitude…especially if using 48kHz sampling rate where the exact peak may not be captured in the impulse response. Note that this does not affect the frequency response, it just moves the energy elsewhere in the impulse pre/post ringing (ie Gibbes effect).

Returning to the measurement configuration Daihedz has been using. You can see that there will be multiple reflections arriving at the microphone after the initial impulse separated by 1mS. Each one will have traveled a unique path combination of reflections and transmissions which I tried to illustrate.
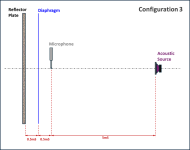
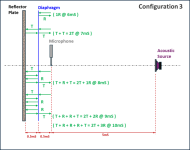
Here is the resulting impulse and frequency response for the first 5 reflections.
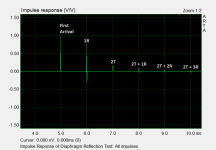
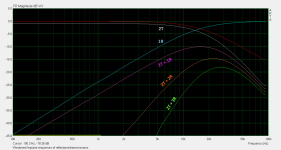
The 2nd and subsequent reflections have transmitted twice thru the diaphragm so the HF roll of is now 12dB/oct instead of 6dB/oct as for the single transmission example in the previous post.
Subsequent reflections from the diaphragm increase the LF roll-off slope by 6dB/oct for each additional diaphragm reflection.


Here is the resulting impulse and frequency response for the first 5 reflections.


The 2nd and subsequent reflections have transmitted twice thru the diaphragm so the HF roll of is now 12dB/oct instead of 6dB/oct as for the single transmission example in the previous post.
Subsequent reflections from the diaphragm increase the LF roll-off slope by 6dB/oct for each additional diaphragm reflection.
Last edited:
Not sure if you had seen it already, but I posted a comparison of with vs without dust covers in some other threads.There is high frequency hash in the decay plot of the quad63. Maybe part of it is due to reflection, I dont know, only by measurig a naked quad versus dustcovered quad we could see.
However this was for my personal diy ESL with 3µm dustcovers spaced about an inch from the stators, not an ESL63.
https://www.diyaudio.com/community/threads/all-acoustat-panels-can-give.282031/post-4551994
https://www.diyaudio.com/community/threads/esl-high-frequency-chaotic-modes.382598/post-6939879
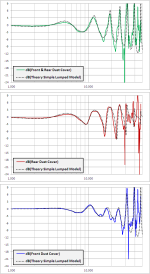
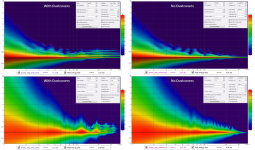
The spacing between the dustcovers and the stators does shift the reflections in time(and peaks/valleys in frequency), but the general response behavior will be the same. I had asked in another thread if somebody could provide me the exact spacing of the dustcovers from the stators, then I could run the model to see the expected behavior for the ESL63 geometry. It was also suggested to build an FIR filter that could be used to "add" dustcovers in DSP to more easily A/B the effect.
Anybody know the dustcover spacing for the ESL63?
Last edited:
For what its worth on the Crosby Quad mod we used 1/2 micron mylar for the dust covers. We got a roll from Dupont many years ago. Lead time was 3 months and it was 5000 feet. Unfortunately it all burned up in a fire years ago. No formal testing but its seemed to be a significant improvement.
Re hydroscopic: Quad said they had problems in Nordic countries in the winter since the humidity was so low it impacted the coating. I don't remember the resolution.
There is a woven screen behind the diaphragm for damping in the 63. Ross Walker used that to explain how material vendors can change things for the better with bad consequences. It got changed so it was slightly conductive, good when using it a a sieve but catastrophic in an electrostatic speaker.
bolserst
Your examples are very important, in particular for high frequencies, which have a short sound wave length.But graphs are one thing and very important, another thing is the assessment of such by our hearing.
The reflected signal (HF) from the protective films is mixed with the direct signal from the working membrane, creating a mixed signal, that is, frequency interference (interference porridge).
As a result, our ears receive signals coming from different time periods, this is expressed in the indistinctness of the HF inaccuracy.
It turns out that the acoustic lens that was used in these speakers (HF only in the middle of the panel) is leveled.
68mm between the front-rear dust foils as good as I can measure.Anybody know the dustcover spacing for the ESL63?
Jan
I guess you mean ½ mil = 12 micron, not ½ micron. Can't imagine what it is to work with 0,5 micron, as 3 micron is already a PITA to work with.For what its worth on the Crosby Quad mod we used 1/2 micron mylar for the dust covers. We got a roll from Dupont many years ago. Lead time was 3 months and it was 5000 feet. Unfortunately it all burned up in a fire years ago. No formal testing but its seemed to be a significant improvement.
Re hydroscopic: Quad said they had problems in Nordic countries in the winter since the humidity was so low it impacted the coating. I don't remember the resolution.
There is a woven screen behind the diaphragm for damping in the 63. Ross Walker used that to explain how material vendors can change things for the better with bad consequences. It got changed so it was slightly conductive, good when using it a a sieve but catastrophic in an electrostatic speaker.
0,5 micrometer is not that easy to work with. Used it for electrostatic headphone repair... if i had some I would gladly send it for test.
Excellent research. Also need to see the available width.we used tape to mount it since its was an inch narrower than the frame.
There is a slight complication in this technique: The frontal mic will always pick up direct sound as well as delayed reflections from the film. So, as mentionned by bolserst, you will have to apply gating to cut away the reflection in order to get the reference sound info for transmission. This technique trades the microphone distance to the film vs. the value of this gated reference at the plane of the film.
Within all the spacings variations, one could try to place the microphone very closely to the film. The following measures were performed at 20mm in front and 20mm behind the film (Tejin Mylar 4.2).
Time domain:
Black curve shows the reference impulse, without film and the microphone being placed in the empty film plane.
Grey is the impulse from the microphone 20mm behind the film fitted.
Blue shows the impulse from the microphone in front of the film. It shows the incoming main impulse, overlayed by the impulse of the slightly delayed reflection. The cursors highlight this delay.
Frequency domain:
All three curves have been linearized/referenced for/to an even response of the reference/naked (black), smoothed (FDW) and normalized to 0dB at 600Hz.
Black is the null/naked linearized reference.
Grey is the transmission from the microphone position behind the membrane. E.g. it is that sound, which you would normally hear having passed a dust protection. As expected, there is a falloff at higher frequencies. Strangely and unexpectedly, there are misterous and quite intense jaggies of +-2dB in the passband between 700Hz ... 4kHz. I cannot rule out artefacts stemming from a flawed setup, because I do not have more than this dataset for the moment. It these artefacts show up again in another measurement, then what might be the cause of them ???
Blue is the direct sound and it's superposed reflection by the film, miked in front of the film. It neatly matches the theoretical and expected model comb filtering behavior. The reflection will then be reflected again and again and again and again as shown by bolserst.
Next would be a similar test, but with an extended frontal microphone distance of e.g. 34.3cm to imply a delay of 2ms between the front of the direct sound and the income of the reflection. This will allow to gate the direct's sound impulse to 2ms. And we'll see then what will happen to these transmission jaggies also.
Correct only for the 63 model.68mm between the front-rear dust foils as good as I can measure.
Jan
All later models starting with the 988 - 989 have a front-rear dust covers distance of 58 mm.
That means that the distance from charged diaphragm to the grille is different too.
Also the horizontal curving of the grille is different from 63 compared to later models.
Next the structure of the grilles is different on the 988-989, no Venetian shades like the 63, but flat perforated metal plates with V-shapes stiffness bending.
The grilles change again with the 2805-2905 and 2812-2912 models, also flat perforated plates, but now with extra constructions in front of the ring panels.
Very fine measurements. The analytical results match your measurements quite well...nearly exact peak/valley spacing when distance adjusted to 21mm.Black curve shows the reference impulse, without film and the microphone being placed in the empty film plane.
Grey is the impulse from the microphone 20mm behind the film fitted.
Blue shows the impulse from the microphone in front of the film. It shows the incoming main impulse, overlayed by the impulse of the slightly delayed reflection. The cursors highlight this delay.
Frequency domain:
All three curves have been linearized/referenced for/to an even response of the reference/naked (black), smoothed (FDW) and normalized to 0dB at 600Hz.
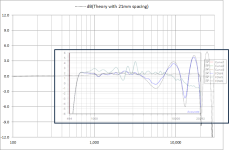
My guess would be it is diffraction from the frame that holds the diaphragm.Grey is the transmission from the microphone position behind the membrane. E.g. it is that sound, which you would normally hear having passed a dust protection. As expected, there is a falloff at higher frequencies. Strangely and unexpectedly, there are misterous and quite intense jaggies of +-2dB in the passband between 700Hz ... 4kHz. I cannot rule out artefacts stemming from a flawed setup, because I do not have more than this dataset for the moment. It these artefacts show up again in another measurement, then what might be the cause of them ???
When you took the reference impulse measurement, did you do it with an empty frame in place?
You would need to do that to include the diffraction in the reference signal that gets used to normalize the diaphragm transmission impulse measurement.
Thanks for the additional information on range of front-to-rear dust cover spacings.Correct only for the 63 model.
All later models starting with the 988 - 989 have a front-rear dust covers distance of 58 mm
I'll put together models that covers both spacings.
One other question came to mind, is the spacings of the dust covers symmetric? ie are they the same distance from their respective stators?
Or perhaps is the front dust cover closer to the front stator then the rear dust cover is from the rear stator.
- Home
- Loudspeakers
- Planars & Exotics
- QUAD ESL63 dust protection comparative testing