Let's try new ways to measure the distortion of power amp output stages, with inspiration from the Gedlee metric. This is the concept:
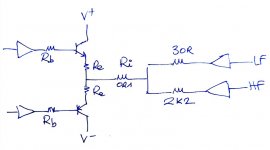
How it works
The DUT, output stage under test (here, the usual push pull) has its bases driven and biased. Its output is set to 0V at DC.
Current is injected into its output by the two drive amplifiers on the right, via the associated resistors.
LF amplifier channel outputs a large low frequency signal (0.5-1A, 40Hz) which sets the "DC" operating point of the DUT, basically the current in both transistors.
HF amplifier channel outputs a high frequency low amplitude current (few mA, 20-40 kHz), which is injected into the output stage.
A bunch of high performance instrumentation amplifiers (AD8421) monitor voltage in interesting places:
- output voltage
- output current (for verification)
- emitter resistors to measure current through both transistors
- base resistors to measure base current
- Vbe, if needed
Implementation
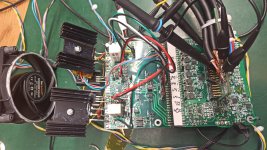
Control: STM32G0 (12 bit ADC), and 4 channel 12 bit I2C DAC, with amplifiers.
Current drive amp: Modulus-86 with DC servo deactivated on one channel.
DUT Base drive: 2 channel TPA6120 composite.
The base drive amps and the high current drive amp are controlled at DC by the micro and DAC, and AC coupled with the soundcard, so they can output DC plus AC signal.
DUT bias current can be set either directly (if both bases are driven) or via the usual Vbe multiplier, which is controller by an optocoupler. In both cases, the micro can set and measure the bias current.
Soudcard: Steinberg UR-44C (4 out, 6 in, 24b-192k)
Power supply: 2x programmable KD3005P 30V 5A
Since all parameters are controlled, 4-quadrant testing is possible: for example the output stage can be driven by a sine wave, and its output current by a phase shifted sine wave, which can emulate any reactive load impedance. Additionally, the power supplies are controlled, so behavior can be investigated over the whole Vce/Vds range.
The whole thing is scripted with python.

How it works
The DUT, output stage under test (here, the usual push pull) has its bases driven and biased. Its output is set to 0V at DC.
Current is injected into its output by the two drive amplifiers on the right, via the associated resistors.
LF amplifier channel outputs a large low frequency signal (0.5-1A, 40Hz) which sets the "DC" operating point of the DUT, basically the current in both transistors.
HF amplifier channel outputs a high frequency low amplitude current (few mA, 20-40 kHz), which is injected into the output stage.
A bunch of high performance instrumentation amplifiers (AD8421) monitor voltage in interesting places:
- output voltage
- output current (for verification)
- emitter resistors to measure current through both transistors
- base resistors to measure base current
- Vbe, if needed
Implementation

Control: STM32G0 (12 bit ADC), and 4 channel 12 bit I2C DAC, with amplifiers.
Current drive amp: Modulus-86 with DC servo deactivated on one channel.
DUT Base drive: 2 channel TPA6120 composite.
The base drive amps and the high current drive amp are controlled at DC by the micro and DAC, and AC coupled with the soundcard, so they can output DC plus AC signal.
DUT bias current can be set either directly (if both bases are driven) or via the usual Vbe multiplier, which is controller by an optocoupler. In both cases, the micro can set and measure the bias current.
Soudcard: Steinberg UR-44C (4 out, 6 in, 24b-192k)
Power supply: 2x programmable KD3005P 30V 5A
Since all parameters are controlled, 4-quadrant testing is possible: for example the output stage can be driven by a sine wave, and its output current by a phase shifted sine wave, which can emulate any reactive load impedance. Additionally, the power supplies are controlled, so behavior can be investigated over the whole Vce/Vds range.
The whole thing is scripted with python.
What it measures
"Come on, can't you just measure the output voltage of a static signal, in a resistive load, with feedback loop closed, to make sure there is nothing interesting to see, like anyone else does? I mean what else would anyone need? THD is all you need Besides, magic ears are better than science. You can't measure the pixie dust

 "
"
Basically: In all modern power amplifiers, the output stage is current-driven, ie driven from a relatively high impedance.
Transconductance (gm) of the output stage would be the most important parameter if it was driven from a low impedance voltage source. But in a real amp, with a quite high drive impedance, the actual current gain of this output stage is going to matter a lot more than just gm. Ideally, it should have high and constant current gain over the output current range, especially near the crossover, so that it its drive current does not create nonlinear distortion when pulled from the impedance of the previous stage. So this is one of the measurements I'll do here.
Because AD8421 has ridiculously low noise, high bandwidth, and CMRR, we can ask more interesting stuff like "what actually is the input current of this output stage?" Because that input current will have to come from somewhere with a pretty high output impedance. In fact,
The CFP output stage is going to lose this shootout, because it is garbage, so it may as well go in first. MJL1302/3281 as muscle, MJE15030/1 as drivers, 0R33 emitter resistors... nothing out of the ordinary. It is biased at 50mA, which is a bit low.
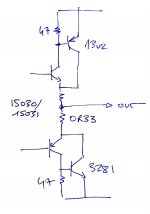
So, I inject 0.5A, 24kHz current into the output, and look at the base current. The instrumentation amplifiers make very nice differential probes with gain of 130 and very low noise.
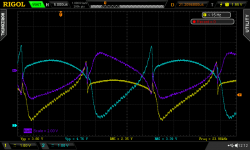


 Cyan and yellow are the base currents of the two drivers. Purple is the sum, which is what the previous stages of the amplifier will have to provide in order to make this output something vaguely resembling the desired sinewave current.
Now come on, 24kHz? At audio frequency it will be fine, check 4 kHz...
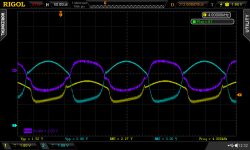
This is still terrible, as if there was a sharp change in current gain between the crossover region (both devices conducting) and the rest of the state space where only one device conducts.
Therefore...
"Come on, can't you just measure the output voltage of a static signal, in a resistive load, with feedback loop closed, to make sure there is nothing interesting to see, like anyone else does? I mean what else would anyone need? THD is all you need
Basically: In all modern power amplifiers, the output stage is current-driven, ie driven from a relatively high impedance.
Transconductance (gm) of the output stage would be the most important parameter if it was driven from a low impedance voltage source. But in a real amp, with a quite high drive impedance, the actual current gain of this output stage is going to matter a lot more than just gm. Ideally, it should have high and constant current gain over the output current range, especially near the crossover, so that it its drive current does not create nonlinear distortion when pulled from the impedance of the previous stage. So this is one of the measurements I'll do here.
Because AD8421 has ridiculously low noise, high bandwidth, and CMRR, we can ask more interesting stuff like "what actually is the input current of this output stage?" Because that input current will have to come from somewhere with a pretty high output impedance. In fact,
The CFP output stage is going to lose this shootout, because it is garbage, so it may as well go in first. MJL1302/3281 as muscle, MJE15030/1 as drivers, 0R33 emitter resistors... nothing out of the ordinary. It is biased at 50mA, which is a bit low.

So, I inject 0.5A, 24kHz current into the output, and look at the base current. The instrumentation amplifiers make very nice differential probes with gain of 130 and very low noise.

Now come on, 24kHz? At audio frequency it will be fine, check 4 kHz...

This is still terrible, as if there was a sharp change in current gain between the crossover region (both devices conducting) and the rest of the state space where only one device conducts.
Therefore...
Let's switch to AC measurements. Still the same setup, but using the soundcard instead of the scope.
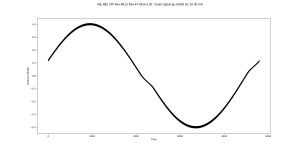
The current drive amp pushes a 40Hz 0.5A + 24kHz 10mA current into the output of this CFP output stage.
The soundcard acquires all signals: base currents, emitter currents, output voltage and current. For example, this is the output voltage of the DUT, where the HF is visible as fuzz on top of the 40Hz wave. The crossover is also clearly visible.
The rest happens in software: the low frequency is filtered out, and the amplitude of the HF sine is detected. Its value corresponds to the derivative of the transfer function that is being measured, in other words the AC small signal gain of the system at the frequency set by the HF sine wave, at the "DC" operating point set by the LF sine wave. A bit of simple math squeezes the juice:
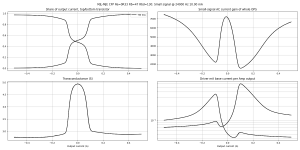
Graphs:
Bottom left is the usual transconductance, or gm. This CFP does suffer from some gm-doubling in the middle.
Top right is the current gain of the whole output stage. As predicted by simulation, it is a mess, there are huge changes in current gain (2000 to 7000) as it exits the crossover region.
Bottom right shows the base currents of the two drivers, expressed in proportion to the AC output current.
On the top left is a graph I find interesting, which is the share of the output current going through each transistor. I'd like to see a smooth transition, which is not what I'm seeing at all here.
If PIM is your thing, it is also possible to plot the phase of the current gain according to output current. Phase variations are pretty large...
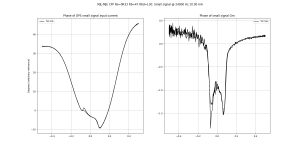
And this last graph is dedicated to Scott, who did not believe this would happen....
Left is second harmonic, right is third harmonic of the HF signal. The fundamental HF signal is normalized to 0dB, and the X axis is output current.
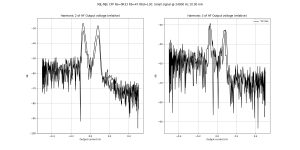
How to interpret this graph: this is essentially the harmonic distortion (2nd and 3rd) of a low amplitude sine wave at a specific value of DC output current. You can imagine the "DC" as a low frequency bass note, and the "HF" as lower level musical signal.
Depending on where we are in the LF signal, the distortion produced by the amp on the HF low level signal varies enormously, by more than 30dB.
The current drive amp pushes a 40Hz 0.5A + 24kHz 10mA current into the output of this CFP output stage.
The soundcard acquires all signals: base currents, emitter currents, output voltage and current. For example, this is the output voltage of the DUT, where the HF is visible as fuzz on top of the 40Hz wave. The crossover is also clearly visible.

The rest happens in software: the low frequency is filtered out, and the amplitude of the HF sine is detected. Its value corresponds to the derivative of the transfer function that is being measured, in other words the AC small signal gain of the system at the frequency set by the HF sine wave, at the "DC" operating point set by the LF sine wave. A bit of simple math squeezes the juice:

Graphs:
Bottom left is the usual transconductance, or gm. This CFP does suffer from some gm-doubling in the middle.
Top right is the current gain of the whole output stage. As predicted by simulation, it is a mess, there are huge changes in current gain (2000 to 7000) as it exits the crossover region.
Bottom right shows the base currents of the two drivers, expressed in proportion to the AC output current.
On the top left is a graph I find interesting, which is the share of the output current going through each transistor. I'd like to see a smooth transition, which is not what I'm seeing at all here.
If PIM is your thing, it is also possible to plot the phase of the current gain according to output current. Phase variations are pretty large...

And this last graph is dedicated to Scott, who did not believe this would happen....
Left is second harmonic, right is third harmonic of the HF signal. The fundamental HF signal is normalized to 0dB, and the X axis is output current.

How to interpret this graph: this is essentially the harmonic distortion (2nd and 3rd) of a low amplitude sine wave at a specific value of DC output current. You can imagine the "DC" as a low frequency bass note, and the "HF" as lower level musical signal.
Depending on where we are in the LF signal, the distortion produced by the amp on the HF low level signal varies enormously, by more than 30dB.
Now, stepping the output stage bias current (values are on the figures):
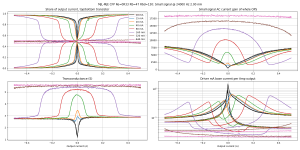
At very high bias (ie, pure class A) the CFP offers excellent performance, current gain and gm are flat, and since the transconductance of both transistors is determined by the emitter resistors over most of the current range (as long as they don't turn off) the top left graph shows they both participate equally to the HF current over the whole range. Note this "current sharing" graph DOES NOT show each transistor's share of the whole current, but only of the HF current.
At low bias current, another run with finer stepping:
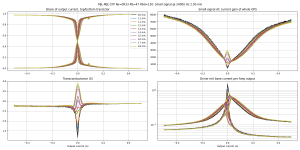
There is no way to get a flat portion in the center, neither for gm or for current gain. It's either underbiased and there is a hole, or overbiased and there is a spike, and the difference is only a couple mA.

At very high bias (ie, pure class A) the CFP offers excellent performance, current gain and gm are flat, and since the transconductance of both transistors is determined by the emitter resistors over most of the current range (as long as they don't turn off) the top left graph shows they both participate equally to the HF current over the whole range. Note this "current sharing" graph DOES NOT show each transistor's share of the whole current, but only of the HF current.
At low bias current, another run with finer stepping:

There is no way to get a flat portion in the center, neither for gm or for current gain. It's either underbiased and there is a hole, or overbiased and there is a spike, and the difference is only a couple mA.
I wonder how to present the data to make it user-friendly... I like XY graphs but maybe time as the X axis would be preferable.
For example this is the same data as previously shown, CFP biased at 50mA. The top curves show current through the top and bottom halves of the output stage. On the low frequency waveform, the soundcard AC coupling slants the bottom of the waveform (in reality it is flat, when the transistor is off the current just stays at zero).
And the bottom curve shows how the HF current is split between the two transistors. Since the amplitude of this HF current is constant (10mA here) when one transistor is off, the other takes 100% of this current, so the curve displays 1.
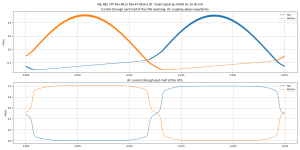
This shows how the crossover works in a CFP (ie, miserably):

Between the two blue {braces}, both power transistors are ON, so everything's fine. Where the red arrows point, one power transistor turns off, but its driver still stays on as long as it has enough current. So, in the area highlighted in green, one power transistor is off, but its driver is still on, which means the current gain of this half of the output stage is only the drivers' hFe (since the power transistor is off).
This is the mechanism behind the sharp drop of current gain right at the exit of the crossover zone (center curve).
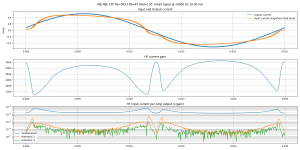
I've also added the harmonics of the drive current (across the friving impedance, that will create distortion). Right at the exit of the crossover zone, this distortion shoots up.
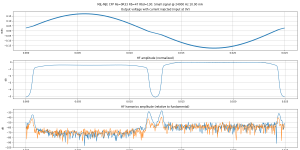
The next graph is another way to present the same data as before. Injecting a HF current of constant AC amplitude in the output, the HF voltage present at the output is basically i/gm, so the curve looks familiar. And the harmonics of that are on the bottom: again, sharp increase in distortion right at the exit of the crossover.
For example this is the same data as previously shown, CFP biased at 50mA. The top curves show current through the top and bottom halves of the output stage. On the low frequency waveform, the soundcard AC coupling slants the bottom of the waveform (in reality it is flat, when the transistor is off the current just stays at zero).
And the bottom curve shows how the HF current is split between the two transistors. Since the amplitude of this HF current is constant (10mA here) when one transistor is off, the other takes 100% of this current, so the curve displays 1.

This shows how the crossover works in a CFP (ie, miserably):

Between the two blue {braces}, both power transistors are ON, so everything's fine. Where the red arrows point, one power transistor turns off, but its driver still stays on as long as it has enough current. So, in the area highlighted in green, one power transistor is off, but its driver is still on, which means the current gain of this half of the output stage is only the drivers' hFe (since the power transistor is off).
This is the mechanism behind the sharp drop of current gain right at the exit of the crossover zone (center curve).

I've also added the harmonics of the drive current (across the friving impedance, that will create distortion). Right at the exit of the crossover zone, this distortion shoots up.
The next graph is another way to present the same data as before. Injecting a HF current of constant AC amplitude in the output, the HF voltage present at the output is basically i/gm, so the curve looks familiar. And the harmonics of that are on the bottom: again, sharp increase in distortion right at the exit of the crossover.

Compare with class A:
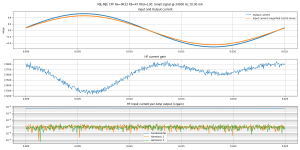
Current gain is almost constant, therefore drive current is linear with output current. It is just a scaled down copy. The harmonics are buried. Of course, setting the bias to 640mA feels like cheating, but well...
Note the HF current is 10mA, current gain is 17800, total vertical span of the middle graph corresponds to a variation of this amplitude of 16 nanoamps, which puts the resolution limit of this setup at something like 1-2 nA. The distortion floor on the bottom graph is about 0.0016%... of the 56µA signal.
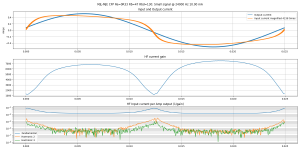
Compare with class quasi-B ; this is the bias that's impossible to hold because it has to be 15 mA, not 13 mA, and not 17mA. The test setup holds this bias steady just fine because it's cheating: Vce is only 15V, there is a fan blowing on the heat sink, each transistor has its own heat sink with grease (no silpad), and the test only runs for two seconds. Otherwise, no way.
And it sucks pretty bad, there is a huge distortion spike at zero current. At least it will show up in a classic THD measurement, unlike the previous 50mA bias, which offsets the current at which the distortion spikes occur, which means a low level THD test won't find them.
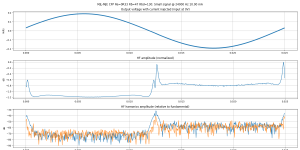
And it sucks pretty bad, there is a huge distortion spike at zero current. At least it will show up in a classic THD measurement, unlike the previous 50mA bias, which offsets the current at which the distortion spikes occur, which means a low level THD test won't find them.


Member
Joined 2009
Paid Member
The load is important, it makes a difference to how the crossover happens, how voltage and current can be out of phase. Graham Maynard looked at this too, looking at the output stage from the outside perspective. Sadly he passed away in 2014.
The GEM.
Upside-Down Differential Amplifier
Incredible quality amplifier by Graham, prepare your ears for it
Graham's Class A/JLH output
The GEM amplifier
I wonder what the CFP looks like under a real load, it has garnered a lot of praise as an output stage so something is there to be learned.
The GEM.
Upside-Down Differential Amplifier
Incredible quality amplifier by Graham, prepare your ears for it
Graham's Class A/JLH output
The GEM amplifier
I wonder what the CFP looks like under a real load, it has garnered a lot of praise as an output stage so something is there to be learned.
Last edited:
Interesting!
I did some sims feeding AC currents to the output of amps, and also found the currents in CFP to really ugly.
I mostly looked at the FFT of the small voltage variations in the output (because of output impedance), that seemed to be a quick and dirty way of seeing the character of the amp.
I think in all cases class A looked good, and I think EF looked pretty good in class AB, since that I have been mostly interested in class A and EF amps.
The reason I tried to simulate it it was that I could not correspond standard distortion measurements with listening impressions, but simulating current to the output of the amp seemed to make better correlation with what I was hearing. I never did it 'IRL' though, looking forward to your conclusions and results! Maybe you could look at the distortion FFT of the amp output voltage while feeding AC current too, to see if that is a valid 'simple method' of doing this IRL?
I think it is not quite so, because here is (a lot)of NFB closed around whole amp, what lowers also internal driving impedance for output stage for orders of magnitude, depending on LG .Basically: In all modern power amplifiers, the output stage is current-driven, ie driven from a relatively high impedance.
Try to drive tested amp e.g. with CCIF signal and at the same time inject to tested amp output some disturbing currents. And simple inspect unwanted artefacts (measure IMD distortion) at output of tested amp. I tried it and nothing unexpected appeared.. ..
Last edited:
Alright!
Mr AKSA> thanks for the kind words.
Bigun> the small class A stage in parallel is interesting. As far as gm is concerned, both would be in parallel, so that's easy to model. But current gain is another story, as that depends on how the current is shared between the two stages, and their own current gain. I will dig into this.
Rallyfinnen> Thanks for the suggestion. I'm trying to get a complete set of tests to run on this CFP before I take it apart and reuse the power transistors for the next topology, so ideas welcome!
I did not do a FFT, I did a logsweep instead, which measures both frequency response and harmonics over the whole range of frequencies. And... since THD ends up being pretty flat with frequency anyway, I set it to run a low amplitude sine current (10mA) with a DC offset current from -300mA to +300mA, and just extract the average THD from that. 120 current steps, 5 seconds per step, 10 minutes. The CFP is at 50mA bias.
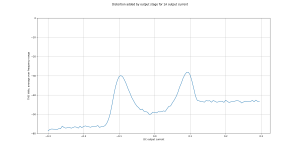
It is expressed in dBV for 1A output current, it's not easy to find a suitable unit that allows comparison between several output stages... so I picked this one, it's basically volts per amps, so "nonlinear ohms".
I can't use THD in % of output voltage, since that depends on the output impedance, so two output stages with different linear output impedance but same absolute distortion would give different numbers. Using "nonlinear ohms" means they get the same number for the same amount of current-dependent distortion.
It is expressed in "volts per 1A" (ie, ohms) but it is measured at 10mA, not 1A.
So, if someone measured the THD of this amp at low level, that would end up in the "valley" between the two peaks, so good numbers for the sales brochure. And while playing music, distortion on low level signals would jump up and down 30dB depending on where the signal is in the big bass notes that come along...
The result is pretty much the same as the bottom graph on this post, except the scale is different. Two THD bumps as it goes in and out of crossover on both sides.
But this measurement that gives the same result takes 2 seconds instead of 10 minutes, because the DC operating current is swept with a 40Hz sine, instead of slowly sweeping the DC voltage and taking a THD sweep at each point. So it is much more convenient. Also the bias doesn't have time to drift due to heating. This one is a CFP, so bias doesn't drift, but with an emitter follower, I don't think the 10 minute test would be usable.
This is useful validation of the fast method, though.
I'm going to rerun it with 15mA bias.
Mr AKSA> thanks for the kind words.
Bigun> the small class A stage in parallel is interesting. As far as gm is concerned, both would be in parallel, so that's easy to model. But current gain is another story, as that depends on how the current is shared between the two stages, and their own current gain. I will dig into this.
Rallyfinnen> Thanks for the suggestion. I'm trying to get a complete set of tests to run on this CFP before I take it apart and reuse the power transistors for the next topology, so ideas welcome!
I did not do a FFT, I did a logsweep instead, which measures both frequency response and harmonics over the whole range of frequencies. And... since THD ends up being pretty flat with frequency anyway, I set it to run a low amplitude sine current (10mA) with a DC offset current from -300mA to +300mA, and just extract the average THD from that. 120 current steps, 5 seconds per step, 10 minutes. The CFP is at 50mA bias.

It is expressed in dBV for 1A output current, it's not easy to find a suitable unit that allows comparison between several output stages... so I picked this one, it's basically volts per amps, so "nonlinear ohms".
I can't use THD in % of output voltage, since that depends on the output impedance, so two output stages with different linear output impedance but same absolute distortion would give different numbers. Using "nonlinear ohms" means they get the same number for the same amount of current-dependent distortion.
It is expressed in "volts per 1A" (ie, ohms) but it is measured at 10mA, not 1A.
So, if someone measured the THD of this amp at low level, that would end up in the "valley" between the two peaks, so good numbers for the sales brochure. And while playing music, distortion on low level signals would jump up and down 30dB depending on where the signal is in the big bass notes that come along...
The result is pretty much the same as the bottom graph on this post, except the scale is different. Two THD bumps as it goes in and out of crossover on both sides.
But this measurement that gives the same result takes 2 seconds instead of 10 minutes, because the DC operating current is swept with a 40Hz sine, instead of slowly sweeping the DC voltage and taking a THD sweep at each point. So it is much more convenient. Also the bias doesn't have time to drift due to heating. This one is a CFP, so bias doesn't drift, but with an emitter follower, I don't think the 10 minute test would be usable.
This is useful validation of the fast method, though.
I'm going to rerun it with 15mA bias.
Whoops! I had forgotten to apply calibration to convert the recorded data into volts so the previous plot has the wrong scale.
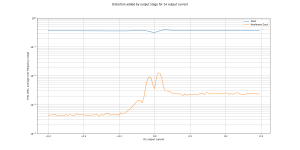
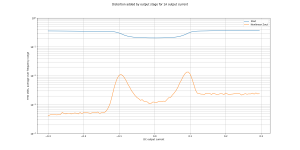
Here is the corrected one. 15mA and 50mA bias. I've added the output impedance of the OPS, and its linear part, both are in V/A, ie Ohms.
And... it did frequency sweeps from 40Hz to 80kHz... I wonder what the base current vs frequency is...
Here is the corrected one. 15mA and 50mA bias. I've added the output impedance of the OPS, and its linear part, both are in V/A, ie Ohms.


And... it did frequency sweeps from 40Hz to 80kHz... I wonder what the base current vs frequency is...
Member
Joined 2009
Paid Member
Peufeu,
I will give you a hint about CFP
Krill - The little amp that might...
TGM8 - an amplifier based on Rod Elliot P3a
Think about parasitic property of CFP ‘shoot through’, compare with operation of Krill amplifier output with h.f. Non-switching and reports that both amplifiers have superb treble.
I believe it’s also worthwhile to look at impact of load on so-called gm doubling.
Last edited:
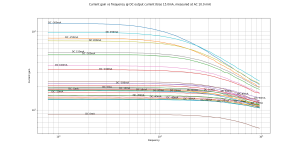
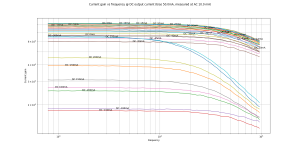
This is the AC current gain of the whole output stage, X axis is frequency, and there is one curve for each DC current injected into the output to set the operating point. I don't like this way of presenting the data.
This is the same information, but each curve is the AC current gain at one frequency, and the X axis is the DC bias current.
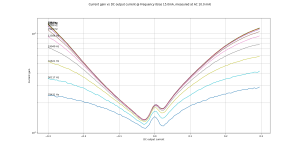
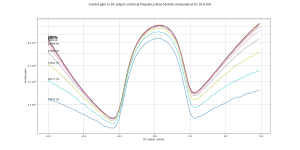
I find the latter one much easier to read, so I will use it in the future. Also it shows that it is more interesting to have good resolution on DC current rather than on frequency. In fact it would be okay to step through a few frequencies, but sweep the DC current with fine resolution. That's already what the original algorithm with the 40Hz sine does, so... no problem.


This is the same information, but each curve is the AC current gain at one frequency, and the X axis is the DC bias current.


I find the latter one much easier to read, so I will use it in the future. Also it shows that it is more interesting to have good resolution on DC current rather than on frequency. In fact it would be okay to step through a few frequencies, but sweep the DC current with fine resolution. That's already what the original algorithm with the 40Hz sine does, so... no problem.
- Home
- Amplifiers
- Solid State
- Power amp OUTPUT STAGE measurements shootout