Glad to see nearly zero port compression up to 120 dB!
The compression measurement was taken with a 80 Hz HPF. Depending on where the tuning sits, the SPL at the port tuning frequency might already be significantly reduced.
We'd also need to know the type of excitation signal. Was what was measured an RMS value (determined via sine sweep, stepped sine, or similar), or are the curves basically peak values created with stochastic noise or a multisine signal, which both have around 12 dB crest factor and would demand much less of the speaker.
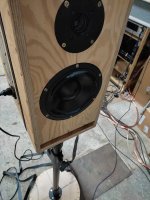
I do think i'll be doing some more investigation on the top end results to understand what might be happening. I think I'll set up a measurement rig as shown below and vary the elevation of the mic over several positions to see the effect in the HF.
That's good to hear, and I agree with the idea of checking the influence of slight vertical variations. I'd definitely also measure and compare different rotational axis - especially the very front of the speaker, also the center of the speaker.
To emphasize my previous point, I don't believe there's a fundamental reason why a turntable run should produce a completely different directivity chart than an NFS scan, especially if just in the high frequency region. But of course, both need to be set to measure the same thing. If the rotational axis and/or the measurement distance, or anything else of significance within the measurement setup or settings are different, there will be different results.
Because I don't think I've ever seen such an empirical comparison posted before, here's ours, with results, to provide something tangible, not just empty claims, to show both should generally yield close to the same result:
NFS:
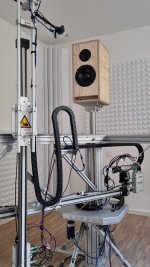
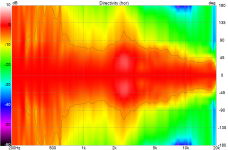
Turntable:
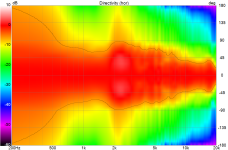
The NFS software, when asked for a CEA2034 output, reduces its point cloud of measuring points to two circular rings, that form the model of CEA2034; an abstraction and interpolation of a spherical space from two circles. Erin @bikinpunk will know if the NFS tweaks that CEA2034 output to weight in what the robot knows due to what it measured and make the CEA2034 more precise according to data.
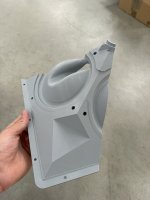
In the case of th eight-fold solana waveguide it is very easy to come to differing results: four of the protruding geometries are interrupted by ports, which will definitely interfere with very short wavelengths. And the eight valleys can easily become beaming devices, insofar as they allow very wide lower frequencies and the throat would need to be optimized to make the top end very wide as well.
I think its a complex geometry, and if you want to stick to the eight-fold approach, optimization and simulation along the single channels is required: along the valley, the bulges, and the bulges with entry ports.
I am not surprised you could not catch this at first, although it should be observable with observation scripts that aim at the specific angles. But I would still like to understand the technical reasons for differences between the NFS and the turntable measurements.
I told John on Instagram before: an option with cheaper drivers would make me want to build one too.
I absolutely love the size factor and the point source nature. SPL is good enough for smaller outdoors events and this makes it superior for many urban dwellers like myself to the SynTripp, which is a performance class higher than necessary, and much bulkier. This system would fit on a cargo bike easily.
I absolutely love the size factor and the point source nature. SPL is good enough for smaller outdoors events and this makes it superior for many urban dwellers like myself to the SynTripp, which is a performance class higher than necessary, and much bulkier. This system would fit on a cargo bike easily.
I plan to try this indoors... Is this a bad idea??
Have always been fascinated by the MEH concept, even bought a Danley Studio 2 but it wasn't what I expected. I guess I have been spoilt by the precision and finish of upper end home audio and the Studio was a bit too large and it had some MiniDSP problems so I never warmed up to it. Then I exploded in printing Marcel's horns with 10-12 different adaptors for 10-12 different compression drivers... But I simply could not resist the Solana, made the donation and I am super excited to try it, mid bass drivers are expected to become available soon, CD pair is on its way.
Have always been fascinated by the MEH concept, even bought a Danley Studio 2 but it wasn't what I expected. I guess I have been spoilt by the precision and finish of upper end home audio and the Studio was a bit too large and it had some MiniDSP problems so I never warmed up to it. Then I exploded in printing Marcel's horns with 10-12 different adaptors for 10-12 different compression drivers... But I simply could not resist the Solana, made the donation and I am super excited to try it, mid bass drivers are expected to become available soon, CD pair is on its way.
I told John on Instagram before: an option with cheaper drivers would make me want to build one too.
I absolutely love the size factor and the point source nature. SPL is good enough for smaller outdoors events and this makes it superior for many urban dwellers like myself to the SynTripp, which is a performance class higher than necessary, and much bulkier. This system would fit on a cargo bike easily.
The topic of alternative drivers is a little tricky. I typically use loudspeakerdatabase.com when starting out on a design by downloading a few dozen candidates and simulating them. The 6NDL38 was in general the best performer for this particular application, albeit not exactly cost effective. There was an 18sound design that also came close (6ND430 I think?), but those are still pricey.
Strictly speaking in terms of T/S parameters, I think there are viable budget possibilities if you forgo full-range operation (external sub) and if you might not need the full SPL capabilities/headroom from the B&C. The other consideration is the actual size and geometry of the mounting flange. It seems like for 6.5" drivers in general, OEMs typically have 2 basket styles - circular and this "square-ish" shape. The round baskets seem to usually be 165-180mm wide.
If looking at just the circular part of the 6NDL38, its 161mm across. This seems to be loosely adhered to by most OEMs offering the squareish style baskets with some exceptions. The bolt circle diameter of 175mm however seems to be less standard across OEMs, with some using 171mm diameter spacing. Currently there is about a 1.5mm clearance from driver-driver after accounting for gasket compression.
To wrap it up though, I'm not opposed to alternative driver arrangements if there's a candidate that can fit the spacing needs without excessive modification to the rear geometry of the waveguide, and of course if there's enough interest in it. This would likely be in the form of an alternative .STL file in the DIY package with the appropriate bolt hole spacing & gasket relief profile. Open to suggestions if there's any particular drivers people think could be a good fit/worth testing out.
I plan to try this indoors... Is this a bad idea??
It should work quite well indoors. When I'm not deploying mine for PA duties, they're usually set up in my listening room or living room.
Hello,
I looked at the documentation and your Solana design is really nice but these days rather expensive for those who like to play with DIY audio just for fun.
Also in my case I'd like to use it at home and thinking of a cheaper version, even if with less performance, I wanted to ask if only two woofers per speaker could be used, and what do you think of the Faital 6fe100 woofers which apart from the shape of the flange seem to have dimensions and parameters compatible with the design as well as being cheap.
Congratulations on your work.
Guglielmo
Hello,
I looked at the documentation and your Solana design is really nice but these days rather expensive for those who like to play with DIY audio just for fun.
Also in my case I'd like to use it at home and thinking of a cheaper version, even if with less performance, I wanted to ask if only two woofers per speaker could be used, and what do you think of the Faital 6fe100 woofers which apart from the shape of the flange seem to have dimensions and parameters compatible with the design as well as being cheap.
The MEH design that's in the first post of this thread, or some variation of it may be a better fit if you're looking for something to utilize 2x6.5" woofers. I really need to revisit that design and make a better horn & mounting solution for it though. I've learned a lot since then and have a few Ath projects with much better profiles that have wider vertical polars than the original while keeping a similar form-factor. Might be something to tackle later this summer.
Just like to say that Solana is a pretty cool design. Would 2 x 6.5" woofers be possible for a 90 x 45 dispersion? This cuts cost of woofers by half and will reduce floor and ceiling bounce for home listening.
If the horn's vertical height is large enough to provide pattern control, yes.Would 2 x 6.5" woofers be possible for a 90 x 45 dispersion?
This horn's height is not large enough to provide pattern control in the woofer range:
The vertical dispersion expands from ~45 degrees in the 4kHz range to over 90 degrees at 1kHz, ~180 degrees in the 500-600Hz range.
I thank you for your proposal, it is much more than I hoped for, I am in no hurry and look forward to admiring your new creations. Relative to the control of vertical dispersion, very large waveguides are probably more effective but in a normal home the size of the Solana I believe is close to the maximum tolerable by any hifi enthusiast wife.The MEH design that's in the first post of this thread, or some variation of it may be a better fit if you're looking for something to utilize 2x6.5" woofers. I really need to revisit that design and make a better horn & mounting solution for it though. I've learned a lot since then and have a few Ath projects with much better profiles that have wider vertical polars than the original while keeping a similar form-factor. Might be something to tackle later this summer.
I'm planning on starting an FDM print (PETG) as well of the Solana waveguide.
The document specifies some infill settings, but some questions remain such as recommended wall loops?
In general, I was wondering what the expected impact of layer height is to sound quality?
Does the inside of the waveguide need to be completely sanded smooth to achieve the highest performance?
The document specifies some infill settings, but some questions remain such as recommended wall loops?
In general, I was wondering what the expected impact of layer height is to sound quality?
Does the inside of the waveguide need to be completely sanded smooth to achieve the highest performance?
I'm planning on starting an FDM print (PETG) as well of the Solana waveguide.
The document specifies some infill settings, but some questions remain such as recommended wall loops?
In general, I was wondering what the expected impact of layer height is to sound quality?
Does the inside of the waveguide need to be completely sanded smooth to achieve the highest performance?
I've used 3 perimeters with success in my prints. As far as I've been able to tell, layer lines don't have a large impact on sound quality. However, it's not going to hurt anything to sand the waveguide for a smooth finish. I'm certain I've seen some talk about that topic in the Ath thread, but can't seem to find the post.
As far as achieving a smooth finish goes, a filler primer makes it very easy to do. I'd recommend using flexible sanding pads like below as they speed up the process considerably around the peaks and valleys.
Adding the updated NFS measurements from @bikinpunk below. Going to experiment a bit with the crossover implementation to see if anything can be done about that waistbanding around 1kHz.


Attachments
Wow would not have thought this from the polars alone. What is the scale for Directivity Index? The x axis does not seem to be 0?Other notes: as John said, it’s nice to see that
a) the port doesn’t create any irregularities; evidenced by the symmetry of the horizontal contour. If the port were resonating you’d see the side-bias here and what little I do see is me looking hard for any inconsistencies. The group delay also shows no large differences through the midrange which is another sign of no port or enclosure resonance.
b) the directivity is damn near perfect. I haven’t seen sound power this linear since I reviewed the KEF Blade 2 Meta (below). This means any issues in linearity can be resolved via EQ or if one wants to add “flavor” this can easily be done without worrying about the early reflections not matching the direct sound in a room.
KEF Blade 2 Meta below. Amazing performance from a passive speaker. Albeit at $30k/pair.
https://www.erinsaudiocorner.com/loudspeakers/kef_blade2_meta/
View attachment 1463743
@bikinpunk I realise my mistake, the sonogram is normalized and cut at 0 dB. So only in the diagram showing the curves for different angles shows that below 200 Hz +- 90 Deg has higher Spl than the on axis response.
@galucha, thank you for the input!
I'll get cracking over the weekend on printing the waveguide.
In the meanwhile I'm working on the box design. Would you be willing to share the parameters you used in WinISD to model this as a coaxial driver? For example displacement of the assembled waveguide plus drivers would be very useful 🙂
By the way, in my initial enthusiasm I forgot to congratulate you on a fantastic design, and thank you for releasing this for personal use!
Thank you!
The waveguide assembly with drivers occupies approximately 9.75 liters of volume. I've updated the DIY .zip package on my website with a winISD project file that can be used. Its not 100% accurate above 200Hz or so, but should give you the important bits needed for modeling a rear enclosure & port(s). The front chamber parameters are fixed and should not be modified.
I use a 6th order bandpass model as the rear port tuning affects air velocity coming out of the front ports inside the waveguide by reducing cone excursion around Fb. So definitely look at the front port air velocity window as you adjust parameters and simulate the HPF.
What about something like the FaitalPro 6RS140. In my head I have a vision of a version of the solana that goes down to 200hz, then crossed with a pair of 12in drivers flanking it similar to how JBL and Lacoustics have their line arrays setup.The topic of alternative drivers is a little tricky. I typically use loudspeakerdatabase.com when starting out on a design by downloading a few dozen candidates and simulating them. The 6NDL38 was in general the best performer for this particular application, albeit not exactly cost effective. There was an 18sound design that also came close (6ND430 I think?), but those are still pricey.
Strictly speaking in terms of T/S parameters, I think there are viable budget possibilities if you forgo full-range operation (external sub) and if you might not need the full SPL capabilities/headroom from the B&C. The other consideration is the actual size and geometry of the mounting flange. It seems like for 6.5" drivers in general, OEMs typically have 2 basket styles - circular and this "square-ish" shape. The round baskets seem to usually be 165-180mm wide.
View attachment 1464391View attachment 1464390
If looking at just the circular part of the 6NDL38, its 161mm across. This seems to be loosely adhered to by most OEMs offering the squareish style baskets with some exceptions. The bolt circle diameter of 175mm however seems to be less standard across OEMs, with some using 171mm diameter spacing. Currently there is about a 1.5mm clearance from driver-driver after accounting for gasket compression.
View attachment 1464389
To wrap it up though, I'm not opposed to alternative driver arrangements if there's a candidate that can fit the spacing needs without excessive modification to the rear geometry of the waveguide, and of course if there's enough interest in it. This would likely be in the form of an alternative .STL file in the DIY package with the appropriate bolt hole spacing & gasket relief profile. Open to suggestions if there's any particular drivers people think could be a good fit/worth testing out.
- Home
- Loudspeakers
- Multi-Way
- Portable Battery Powered MEH Build
