I must say you did a fine job with these. Very neat, clear and the white color does seem to hide them a bit better than my "flashy" setup.
I see you have a couple of questions. First one was about imaging... you did find a solution with toe-in. The more interesting thing would be to see how this setup with that ~45 degree toe-in measures at the listening position compared to the previous position. Then we start to learn something from it 🙂.
I chose white for that very reason, to hide them. The two thin vertical lines up the sides i thought added a bit of class. I pushed hard for the flush mounting both for the asthetics and diffraction (at least I think it does???).
I'll try to get mearurement tonight but no guarantees. Having 2 kids does not make for a quiet house.
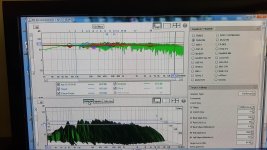
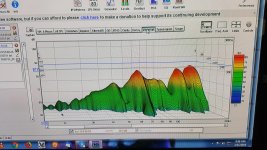
Attached is a previous attempt at equalizing in REW. I am struggling to get the low end up. Sorry for the poor photo quality.
Attachments
I see you have a couple of questions. First one was about imaging... you did find a solution with toe-in. The more interesting thing would be to see how this setup with that ~45 degree toe-in measures at the listening position compared to the previous position.
What would happen to the image if I moved the speakers towards the corners and moved my listening position back in the room? I feel like I am stuck way to far forward in the room for a living room ( I know that forward is usually ideal). I probably wouldn't need as much toe-in.
I'd say just try it! No harm in that... I see pretty clear side walls, but they are not similar.
Moving the arrays to the sides could reinforce the bottom end, but will also cause reflections off of those walls. This doesn't have to be a bad thing, but kind of feels like "the same sauce on every song" to me. But if it's a good sauce. 😉
Try to play with distance of speaker to back wall too, if you can, take your time and try out several things to see what you like best. The hardest thing is that to really know, each position should be re-equalized. But to get an idea of what it does, just try a few things at a time. Limit the simultaneous tweaks.
Say one day play with toe in, another day with more distance between the speakers. Take the time to listen, if it sounds promising, do the re-EQ.
Picture the room like you have mirrors on the wall, everywhere you see the speakers from the listening position in that "mirror", a reflection is probably there.
I found that I got the clearest image with the baffle about half a meter off the wall behind it. Toe in was the next experiment. I did not change the corner position much, as i did count on that giving me a stronger bottom end. But that did mean planning at least one damping panel on the side wall to take away the reflections.
Before using that panel (the other side did not have a similar side wall) the stage seemed wider. After hanging up that panel, it changed with each song.
I see you have a couple of questions. First one was about imaging... you did find a solution with toe-in. The more interesting thing would be to see how this setup with that ~45 degree toe-in measures at the listening position compared to the previous position. Then we start to learn something from it 🙂.
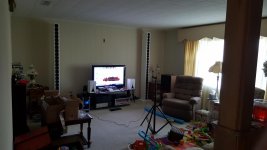
I'll be posting the measurements. Attached is my microphone setup.
Attachments
REW Measurements
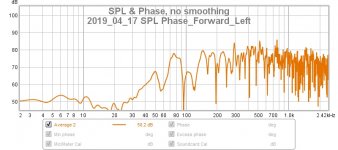
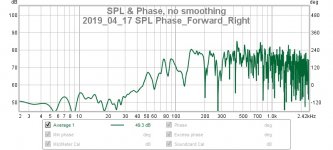
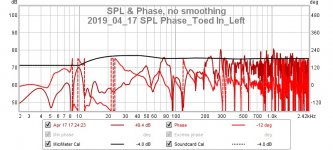
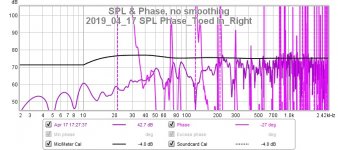
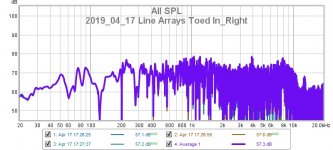
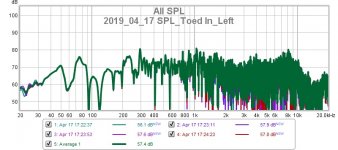
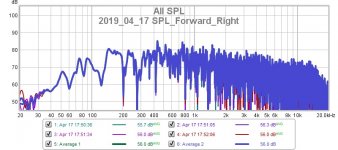
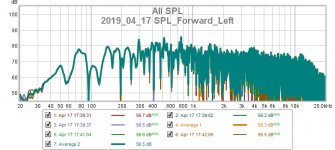
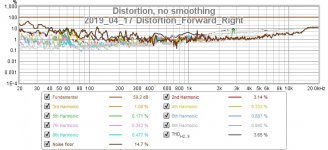
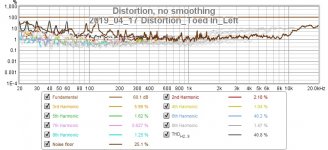
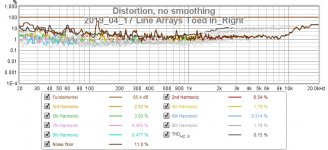
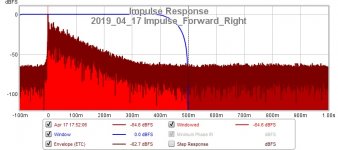
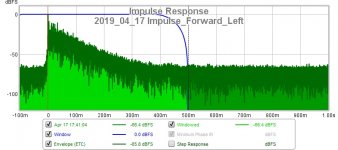
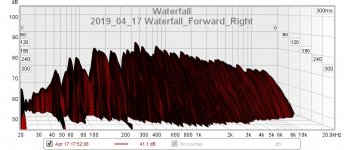
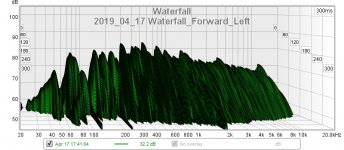
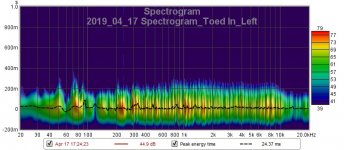
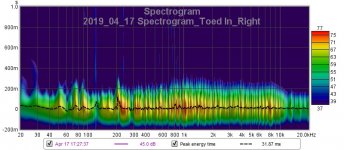
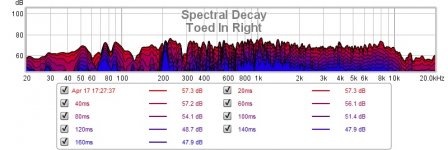
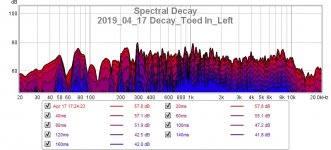
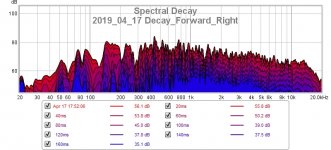
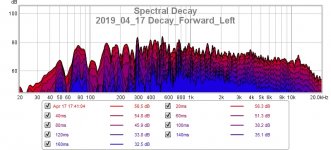
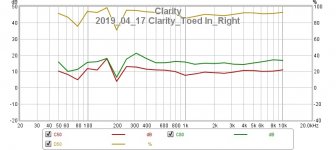
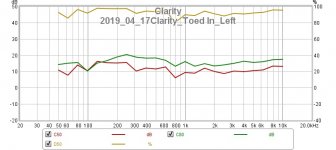
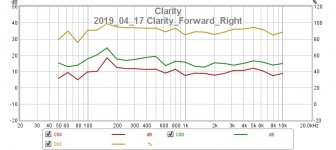
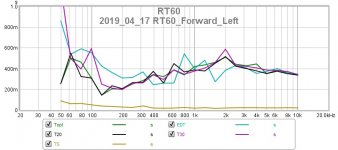
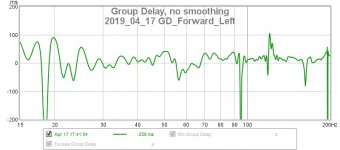
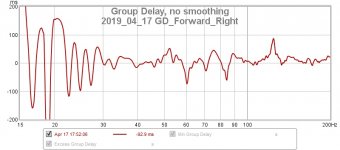
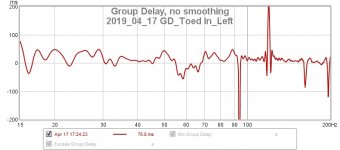
These are measurements of both the left and right speaker both toed in and faced forwards.
SPL & Phase:
These are measurements of both the left and right speaker both toed in and faced forwards.
SPL & Phase:
Attachments


I got the soundcard issue figured out tonight. It was a box I had to check deep down in the preferences under configuration.
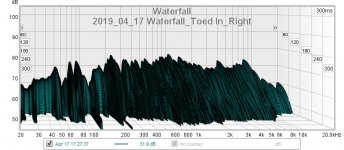
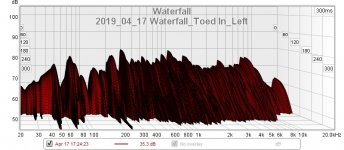
That's a lot of data right there 🙂.
Even if we do see some differences, it is kind of hard to make something out of it right?
We need to "zoom in" in order for these plots to tell us something.
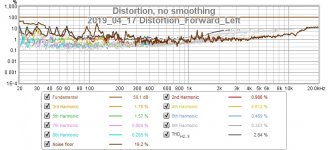
Are these measurements raw without EQ? The reason I ask is because of the general trends of the array being visible and the distortion graphs look funny to me.
I bet things will start to improve with some help. I see a rising distortion, even on the top end and do not see that trend in my setup, not even from my raw measurements. But my "raw" measurements almost always include some basic EQ to get a reasonably straight FR curve. I haven't done a real raw measurement in ages. It is some pré EQ I use to get it ready for further processing.
I think if we EQ the lines, the distortion graph will look a lot better.
First we might want to look more closely at these graphs. Use the limit button (upper right corner) to get the graphs more in proportion/scale and zoom in a little here and there.
Even if we do see some differences, it is kind of hard to make something out of it right?
We need to "zoom in" in order for these plots to tell us something.
Are these measurements raw without EQ? The reason I ask is because of the general trends of the array being visible and the distortion graphs look funny to me.
I bet things will start to improve with some help. I see a rising distortion, even on the top end and do not see that trend in my setup, not even from my raw measurements. But my "raw" measurements almost always include some basic EQ to get a reasonably straight FR curve. I haven't done a real raw measurement in ages. It is some pré EQ I use to get it ready for further processing.
I think if we EQ the lines, the distortion graph will look a lot better.
First we might want to look more closely at these graphs. Use the limit button (upper right corner) to get the graphs more in proportion/scale and zoom in a little here and there.
Last edited:
I haven't got the time to go trough them one by one right now.
Start by saving these graphs a bit bigger, plot the SPL graps with 5 dB division on the scale to the left of the graph, leave phase out for now and smooth them to, let's say 1/12. Make the top 100 dB (limits button), bottom 45 dB, left is 20 Hz, right is 20000 Hz. Save them to about 900 pixels image width to have a readable graph.
At least we get to see a general FR trend that way. One thing is clear, the toe-in has a rather different balance than the face front setup. It also interacts differently with the room. That much we can see right now.
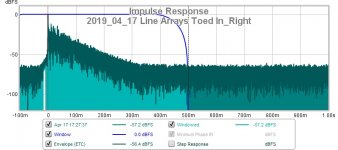
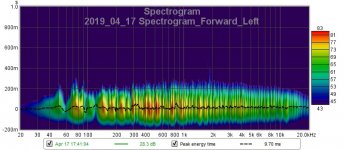
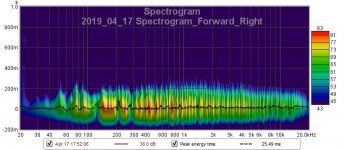
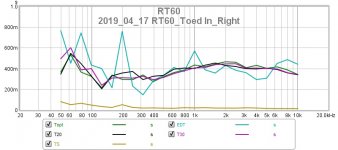
After that plot let's look at the IR's, your plots are in dBFS, nothing wrong with that to see the strength of reflections but we need a closer look.
Push the limit button, set it to dBFS Top: 10, dBFS bottom -50, Left s -0.001 and Right s to 0,050. Let's see the graphs from both setup's that way.
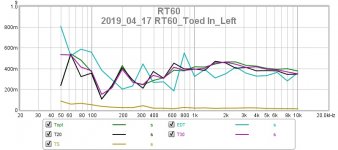
Next on the left side inside the graph, you can set it to % instead of dBFS.
On that graph change the Right s to 0,020 and plot all graphs like that.
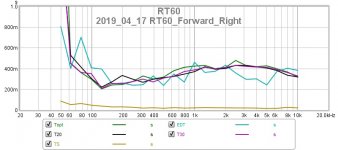
Those will do for now, lets first see the balance, we might want to change that.
So no new measurements at this point, just a different view on what you've got here.
Got to run now, hope to get back to you later tonight. I'm sure there are others that can help, feel free to jump in. 🙂
Start by saving these graphs a bit bigger, plot the SPL graps with 5 dB division on the scale to the left of the graph, leave phase out for now and smooth them to, let's say 1/12. Make the top 100 dB (limits button), bottom 45 dB, left is 20 Hz, right is 20000 Hz. Save them to about 900 pixels image width to have a readable graph.
At least we get to see a general FR trend that way. One thing is clear, the toe-in has a rather different balance than the face front setup. It also interacts differently with the room. That much we can see right now.
After that plot let's look at the IR's, your plots are in dBFS, nothing wrong with that to see the strength of reflections but we need a closer look.
Push the limit button, set it to dBFS Top: 10, dBFS bottom -50, Left s -0.001 and Right s to 0,050. Let's see the graphs from both setup's that way.
Next on the left side inside the graph, you can set it to % instead of dBFS.
On that graph change the Right s to 0,020 and plot all graphs like that.
Those will do for now, lets first see the balance, we might want to change that.
So no new measurements at this point, just a different view on what you've got here.
Got to run now, hope to get back to you later tonight. I'm sure there are others that can help, feel free to jump in. 🙂
Last edited:
That's a lot of data right there 🙂.
If you can tell, I have no idea what I'm doing 🙂
Yes, these are all unEQed.
You're right about the distortion, it seems too high. The frequency response also has a strange dip around 120hz.
I've felt that the speakers have sounded fatiguing but I just attributed this the them being line arrays. It may be due to the distortion and frequency dip (and maybe first reflections?).
I've felt that the speakers have sounded fatiguing but I just attributed this the them being line arrays. It may be due to the distortion and frequency dip (and maybe first reflections?).
- Home
- Loudspeakers
- Full Range
- Obtaining my White Whale (25 Driver IDS-25 Line Array Build)