Of course 1.6khz will work slightly better with a 6.5" driver, but I'm surprised at how well it works at 2khz.
From the Toole and Olive preference research the listening window is the most representative of the way the speaker was rated. It also represents an area of space where a number of people could be listening so having the listening window be very similar to the on axis response suggests that the speaker will sound very similar over that area. Being a spatial average it does get smooth minor irregularities between curves due to diffraction etc. but the biggest problems should remain, checking the individual curves is still good practice because a flat result might be because there was a big dip and a big peak that cancelled out
This was my thought. The listening window measurement is most representative of what I will perceive, assuming the system is reasonably behaved in the far off-axis.
Fluid - thanks for the guidance on spinorama data collection. I have to admit, it sounds somewhat intimidating. Testing my system is a bit more complicated because it is not a single box. My woofer cabinet is not really a subwoofer because I use crossover frequency of 150 to 200 Hz (200 currently), so it must be part of the total system under test. The speaker stand is bolted to and wired to the satellite, so any spinorama in the vertical plane has to include the stand and satellite turned on the side.
Ground plane measurements of the low frequency is a higher priority for me. Right now I am using a BW3 at 200 Hz. After a year of tweaking the old SB17CAC system, I found the BW3 200 Hz to be the best sounding and the best measuring option.
The BW3 is forgiving of phase and timing mismatch. When I reverse polarity of the woofer, the response I get tells me that I do not have a perfect BW3 response. Perhaps I have a phase mismatch... It is hard to tell. The only way to get good clean data from 100 to 400 Hz is to go outdoors.
That's goes to show the old rule-of-thumb still works... "the frequency where the 45 degree off-axis curve is 3 db below the on axis curve is the highest crossover frequency for the driver"... That's how we did it in 1990... still works 🙂Of course 1.6khz will work slightly better with a 6.5" driver, but I'm surprised at how well it works at 2khz.
Right now I am using a BW3 at 200 Hz. After a year of tweaking the old SB17CAC system, I found the BW3 200 Hz to be the best sounding and the best measuring option.
A 200Hz sine wave(68") has a quarter wave distance of 17", which is the recommended largest C-to-C between drivers @200Hz. Have you experimented with the woofer positioned <17" from the center of the midrange?
This is not the conclusion I would draw from this, and not what I think fluid said either.This was my thought. The listening window measurement is most representative of what I will perceive,
kimmosto posits VituixCad as a tool capable of designs for commercial speakers, of varying usage, without actually building them, hence the need for some point of general purpose reference. A DIYer could do better with a more focussed approach using different aspects of the tool.
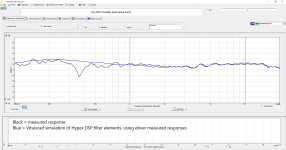
I was curious about the process of designing the DSP filtering for the Hypex amps in a simulated environment, specifically Vituixcad. I already have a workable filter which I developed by iteratively taking measurements and adjusting the filter. I thought the best way to explore the simulation process would be to implement my existing filter in Vituixcad and compare the predicted response to the measured response.
The simulation is based on the individual driver frequency response measurements. The far field gated measurements were merged with the near field responses. I modelled the baffle diffraction effect in Vituixcad, and it provided a 4-pi equivalent low frequency response which was merged to the gated responses. Then each biquad element in my Hypex filter was duplicated in Vituixcad.
I was expecting that there would be some differences in the curves, and I would have to explore each biquad to compare simulation to measured. However, I mildly surprised at how close the simulation matched the measured. Above 1 kHz it is almost an exact match. Below 1 kHz the simulation is smoother because the near field response is used in the simulation. The measured system response, on the other hand, uses a blending feature to merge the room response to the gated measurements below the gating window frequency. So a difference would be expected below 1 kHz, but overall, the two curves are very similar.
In the past I had some trouble with this exact same comparison on my SB17CAC / SB26CDC system. I can only assume that I had some measurement error or a simulation problem.
Now I have more confidence in refining my DSP filters using simulation.
Attachments

That is very good agreement and given how hard it is to take far field measurements without the influence of reflections gives good insight into what is happening. There doesn't seem to be any issue with the filters matching this time, now you can move on to different target slopes or refining the crossover matching from the comfort of wherever you use your computer 🙂Now I have more confidence in refining my DSP filters using simulation.
how do you setup your simulated drivers in your cad? do you measure all drivers from a single microphone point or do you measure all drivers on its on-axis, you adjust mic height to each driver?
The first link from https://www.diyaudio.com/forums/multi-way/366347-active-satori-textreme-post6518973.html will explain it
how do you setup your simulated drivers in your cad?
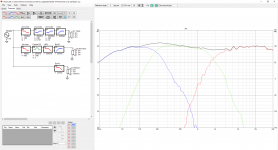
I am attaching my Vituixcad simulation. The filter elements are exactly as implemented in the Hypex HFD software, except for the gain on the woofer. I was using an older near field woofer measurement in the sim, so its level is not consistent with the mid and tweeter levels.
...do you measure all drivers from a single microphone point or do you measure all drivers on its on-axis, you adjust mic height to each driver?
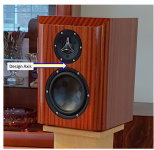
When designing a speaker, Kimmo recommends aligning the mic on each driver’s axis. However, I am not designing a new speaker at this point, I am comparing simulated to measured responses, so I took all measurements from the design axis. For this project I decided the design axis would be the midpoint between the tweeter and the mid (see pic), at a distance of 66 cm. All far field driver responses, as well as the whole system response, would be taken from this point.
Thanks.Well tested, Jim
j.
Attachments
If you have time to compare Textreme pair with your ceramic pair, I would like to hear your impression about those units.
For this next round of filter development, I decided to simulate in advance. And I must admit, it worked better than I expected.
In post 106 I showed the results of simulating (after the fact) my initial DSP filter. Since then, I have slightly refined each driver’s measured response by more carefully merging the near field to the gated far field.
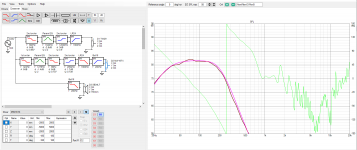
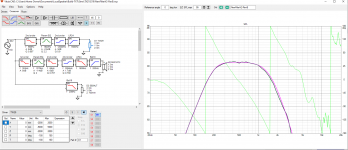
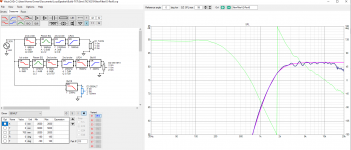
For this new filter, I began with a target response for each driver. The first 3 graphics show the simulated tweeter, mid driver, and woofer responses compared to the idealized target responses (in magenta “purple”). I think I am matching the target curves pretty well. The more I use VituixCad2, the more impressed I become. Truly a great tool.
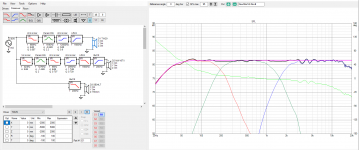
The next graphic is the complete system simulation. It looks outstanding, I am within 1 dB of the target response from 20 Hz to 16 kHz, except for a few diffraction related burbles between 3k and 5k. However, simulations mean nothing if they do not agree with reality.
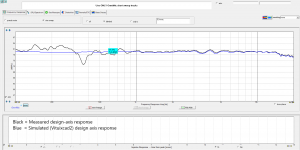
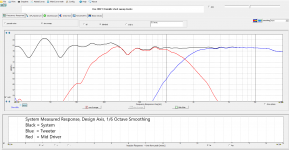
The next plot shows the VituixCad2 simulation compared to the measured response. My gating window is 4.3 ms (floor reflection), so OmniMic software blends in the room response below that point. I am showing 100 Hz up, because below that the room modes become dominant. Overall I am quite pleased with how closely the simulation matches the measured response. The final plot is the system measured response with 1/6 octave smoothing. I like 1/6 octave smoothing because it tends to mimic how we perceive. I believe that peaks and valleys which do not show up in 1/6 octave smoothing are insignificant. I show the mid and tweeter responses here.
I am still doing some careful subjective evaluations. I will talk to this subject soon.
j.
In post 106 I showed the results of simulating (after the fact) my initial DSP filter. Since then, I have slightly refined each driver’s measured response by more carefully merging the near field to the gated far field.
For this new filter, I began with a target response for each driver. The first 3 graphics show the simulated tweeter, mid driver, and woofer responses compared to the idealized target responses (in magenta “purple”). I think I am matching the target curves pretty well. The more I use VituixCad2, the more impressed I become. Truly a great tool.
The next graphic is the complete system simulation. It looks outstanding, I am within 1 dB of the target response from 20 Hz to 16 kHz, except for a few diffraction related burbles between 3k and 5k. However, simulations mean nothing if they do not agree with reality.
The next plot shows the VituixCad2 simulation compared to the measured response. My gating window is 4.3 ms (floor reflection), so OmniMic software blends in the room response below that point. I am showing 100 Hz up, because below that the room modes become dominant. Overall I am quite pleased with how closely the simulation matches the measured response. The final plot is the system measured response with 1/6 octave smoothing. I like 1/6 octave smoothing because it tends to mimic how we perceive. I believe that peaks and valleys which do not show up in 1/6 octave smoothing are insignificant. I show the mid and tweeter responses here.
If you have time to compare Textreme pair with your ceramic pair, I would like to hear your impression about those units.
I am still doing some careful subjective evaluations. I will talk to this subject soon.
j.
Attachments
A few other things I neglected to mention...
I found that I still needed to set my driver levels in Hypex HFD based on direct measurement. The gain settings in the VituixCad simulation were within a few dB, but to really match the simulation I had to adjust each driver by hand. This is possibly some error on my part, or perhaps it is a difference in how Hypex and VituixCad interpret the gain on various filters and shelving function? not sure.
The other aspect which does not simulate well for me is driver delay. This is entirely expected because I use a USB microphone and this is a well known limitation to this kind of system. My solution is that I made my simulations based on a simulated delay which generated the maximum possible inverse polarity null. When I loaded the DSP filter into the Hypex amps, I experimented with delay until I generated the deepest inverse polarity null. At that point I was satisfied that the simulation and the actual DSP filter were equivalent.
I know you like and are familiar with Omnimic but if you used REW and the acoustic timing reference you can get time locked measurements with a USB microphone, at least for your 2 way speaker section.The other aspect which does not simulate well for me is driver delay. This is entirely expected because I use a USB microphone and this is a well known limitation to this kind of system.
Yes I know... it is actually somewhat embarrassing. 🙁 I bought a Behringer UMC202HD and a Dayton EMM6 microphone so I could do "real" measurements in REW with 2 channels. I got it running, and made some measurements of my system... But somehow the process seems annoying. I find REW to be particularly painful. I do not enjoy learning new tools, so as long as I can make do with what I have, I tend to keep using it... It is a fault. The engineers who worked in my team reminded me of this often...
j.
j.
I find REW to be very easy to use but I have used very little else because I tried it first and it does everything I need.I got it running, and made some measurements of my system... But somehow the process seems annoying. I find REW to be particularly painful. I do not enjoy learning new tools, so as long as I can make do with what I have, I tend to keep using it...
You had a similar reluctance with Vituixcad and worked that out so maybe this could be the same 😉
Subjective comparison of SB Ceramic to Satori Textreme
I apologize for the length of this post… OK, on to the question of how the textreme drivers sound compared to the ceramic/aluminum SB drivers. First of all, let me say I did not find any value in listening to the drivers by themselves. I can only comment on how the complete systems sounded.
The existing system consisting of SB17CAC/SB26CDC drivers and the new system of MW16TX/TW29TXN-B drivers. I do not have a blind commitment to SBA drivers, but I feel they offer excellent performance for the price.
Before I give my subjective opinion of these two systems, I should state that there are many similarities between the two systems.
(1) The woofer system remains unchanged: an SB34NRX75-6 in a 70 liter sealed box, a Linkwitz Transform to simulate a 120 liter box with an Fc= 32 Hz and Qtc = 0.71.
(2) The crossover from woofer to mid is 200 Hz BW3 for both systems.
(3) The satellite baffle size, shape, and diffraction control are nearly identical.
(4) Both systems use IIR DSP filtering to optimize the frequency response to be as flat and as smooth as possible on the design axis. In both cases my goal is a very wide horizontal dispersion. In both cases I manage (i.e maximize) the off-axis response by my choice of drivers, my choice of crossover frequency and slope, and my diffraction control.
There are differences between the two systems as well.
(1) Obviously the satellite drivers are different. The diaphragms are different materials, although in both cases the first mode resonance is well outside the passband. The Satori drivers use a more sophisticated motor.
(2) The textreme system has a mid to tweeter crossover at 1.6 kHz while the ceramic system has a 2 kHz crossover.
(3) The design axis of the ceramic system is the tweeter axis. For the textreme system, the design axis is the midpoint between the tweeter and mid.
(4) The new satellite box incorporates my experience in building boxes. It is a better box I believe. It also has a 160 mil layer of Noico butyl rubber noise abatement on the inner surface.
The SB17CAC/SB26CDC system has a lot of detail and clarity. Especially in the very soft quiet moments where they maintain details down to very low SPL. This allows them to convey a very realistic studio or hall ambience, where a plucked string slowly fades to black, or a cymbal rings down to nothing. They transition from soft to loud to soft very realistically. The system is very three dimensional with an excellent presentation of space. Considering the price, this combination is one of the best bargains in DIY.
I was not sure that the SB ceramic drivers could be improved upon, but the textreme system is more revealing, and more natural sounding. This “naturalness” is difficult to quantify or describe. It just seems like I can hear a few layers deeper into the music. This system does everything as well as the ceramic system, but it seems more convincing, more real. Slightly more three dimensional, slightly more clarity. Perhaps the timbres and upper harmonics are more natural. I can only hear it with high quality naturally recorded high resolution files. As much as I like my CD and vinyl collection, I just do not hear enough difference between the two speaker systems with those sources. But with high res digital, I can hear it. For most high res digital, the textreme system allows the performance to feel closer, more palpable. Dynamic contrast might be just slightly better with the textremes.
There is only example I have found where the textreme system has a stepwise superiority over the ceramic system, where it is clearly more revealing; the first movement of the Rachmaninov Piano Concerto No. 2 in C minor, Op. 18. I have this piece on 24 bit/96k FLAC. This piece has the piano playing complex patterns with the sustain pedal, while violins, violas, and cellos are playing counterpoint. A rolling tympany drum adds to the texture. It is harmonically very complex, with so many notes from so many instruments competing to be heard. It is like a firehose of sound. This is one of the few passages where the SB17CAC/SB26CDC system could not maintain a sense of realism. There are times where all the complex sound just blends together. Sometimes I lose the piano, and other times the strings all blend together into one mega instrument.
This is where the MW16TX/TW29TXN-B system proved itself to be superior. I can always hear each distinct string instrument as well as the attack of each piano note. The sustaining piano notes do not muddy the presentation of the new notes being played. The individuality of each musician is maintained.
Value wise, the combination of the SB17CAC + SB26CDC is about $144. The combination of the MW16TX + TW29TXN-B is about $495, almost 4X more. For most products, a doubling in price results in a 10% improvement in performance. Therefore for 4X the price I should see a 20% improvement in subjective performance, and yes I believe I do get at least a 20% higher performance. For me it is worth the cost.
j.
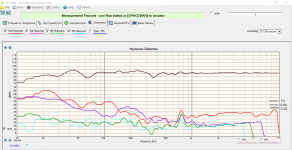
I ran the harmonic distortion measurements yesterday.
My view of HD is that once it is below the audible threshold, it does not matter. Based on surveying a lot of different sources, it seems like 2nd order HD is not audible on program material until it is above 2%, and even when audible, it is not unpleasant. Odd order HD is more intrusive, so I like it to be below 0.5% if possible, but definitely below 1%.
I still need to put the cabinets face-to-face and do the "Remlab cancellation null" test to assess cabinet radiation. And at some point I will re-do the off-axis responses, but I really do not expect there to be much difference from post 96.
Right now I am enjoying "Oscar Peterson plays Count Basie", "Carmina Burana", and The Doors "LA Woman" remastered...
Attachments
- Home
- Loudspeakers
- Multi-Way
- New active Satori Textreme