Allen your rant is justified. When I first read the HFD software manual, I was a bit surprised at how simple they made the process seem. I remember thinking "If I had not designed a number of passive speakers in the past, I don't think I could get a 3 way system set up correctly based on these instructions alone".
There are all kinds of mistakes and pitfalls that an inexperienced DIY constructor could fall into while setting up a Hypex amp, and the instructions should explain this and go through some examples of what NOT to do.
For example
(1) trying to use grossly mismatched drivers
(2) trying to equalize diffraction response uneveness
(3) trying to equalize room response variations in the trasition region
(4) trying to extend bass response with EQ without taking into account driver displacement capability
Any of these (and many other) potential errors are awaiting the inexperienced user, and Hypex really should address some of this stuff.
What if you had a target on your development screen, and tweaked filters until you had that response, maybe like you do now only you didn't need to press measure after each change.
If I could be confident that the simulation matched reality, yes that would be very convenient. As Fluid outlines in post 62, there are reasons why this may not be so.
If you do it that way there could be some discrepancies creeping in in some cases. This is partly why I suggest bringing over only a target transfer function. This and the fact that your own software has its own toolset.
This way, while I use any filter I want when designing beforehand, I'm looking at plots. If I then bring only a plot over to the filter software, I can use whatever tools it has at its disposal to achieve the same transfer curve.
(What I didn't make clear earlier is that when I talk about designing a crossover I'm referring to bringing together the acoustic elements... The filters are just a sub-set of that.)
... the complete set of filters is the target transfer function. now I understand.
Let me think on that...
Let me think on that...
To use any simulation software with the Hypex you need to be able to match the response of the parametric filters. That is the usual sticking point.
The easiest way is to set the Hypex up with a simple EQ and use a measurement software to run a sweep or noise average in an RTA window to see the transfer function. By using set Q's and gains you can see what the Hypex is putting out. Then use REW's EQ function to generate the same EQ settings with it's generic equaliser, scale levels and compare. If they are the same great because that is the most universal variant. If not you can try the MiniDSP setting or the rephase setting to see which one matches or how close it is.
Then try the same thing with shelving filters. If you match it to something in Vituix that will be the best overall solution. Kimmosto might even be able to tell you what to use as I think he has done some commercial design work where the Hypex have been used.
Cabinets are complete. I have always had good luck with General Finishes Arm-R-Seal urethane varnish, so this is what I used... I applied it with a brush, and sanded between coats.
I stuffed the cabinets with long fiber wool. I was worried I would not have enough, but I had just exactly enough. I would have used ultra-touch shredded denim if I had needed more (see Augerpro's excellent thread https://www.diyaudio.com/forums/mul...on-methods-shootout-thread-9.html#post6301785 )
In my modular design, speakers are attached to the stand with a 5/16" bolt. The speaker has a T-nut in the center of the bottom panel. Wires exit the speaker through a small hole in the bottom, and connect to a terminal block in the stand using ring terminals.
I am in the midst of frequency response testing. I hope to have something to show in a day or two.
j.
Attachments

Wow! Beautiful!!
I'd also try a 1.5khz crossover point. You could easily get away with it with that tweeter and a steep slope.
I'd also try a 1.5khz crossover point. You could easily get away with it with that tweeter and a steep slope.
Last edited:
 Look forward to some sweet curves
 Celef
I disagree, it should be rotated one pinhole to the left. 😀
Just kidding, you're right🙂
I disagree, it should be rotated one pinhole to the left. 😀
Just kidding, you're right🙂
Last edited:
Well I have some measurements.
I stuck with the filter development method I am comfortable with, i.e. develop the eq in real time while measuring as I described in post 76. Apologies to AllenB... I did not want to learn a new skill just now.
This is my first prototype DSP filter. It is not complete, I intend to keep tweaking and "voicing" over the several weeks or months. For now I started with a BW3 crossover at 200 Hz (this worked well with the previous system) and LR4 crossover at 2000 Hz.
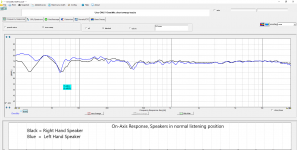
The first plot is the left and right speakers, as measured in their normal positions. The gating window was about 4 ms, and Omnimic blends in the room measurement below the 4 ms cutoff.
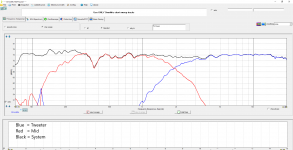
Next plot is the tweeter and mid plotted with the full system response.
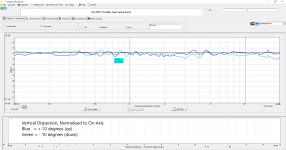
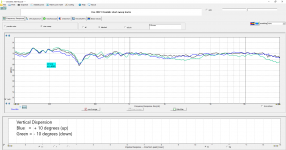
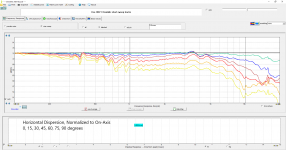
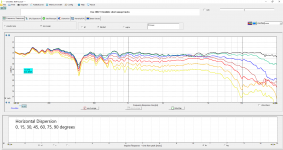
Next is the horizontal and vertical dispersion plots. I am pleased with the polar response.
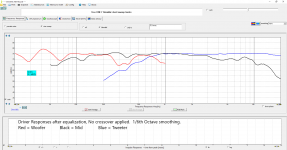
The final plot is the drivers with all EQ applied, but without the crossover filters.
I think I have enough data to load into Vituixcad and have it calculate a listening window, directivity index, and power response. It will be the first time I have used that feature of Vituixcad.
j.
I stuck with the filter development method I am comfortable with, i.e. develop the eq in real time while measuring as I described in post 76. Apologies to AllenB... I did not want to learn a new skill just now.
This is my first prototype DSP filter. It is not complete, I intend to keep tweaking and "voicing" over the several weeks or months. For now I started with a BW3 crossover at 200 Hz (this worked well with the previous system) and LR4 crossover at 2000 Hz.
The first plot is the left and right speakers, as measured in their normal positions. The gating window was about 4 ms, and Omnimic blends in the room measurement below the 4 ms cutoff.
Next plot is the tweeter and mid plotted with the full system response.
Next is the horizontal and vertical dispersion plots. I am pleased with the polar response.
The final plot is the drivers with all EQ applied, but without the crossover filters.
I think I have enough data to load into Vituixcad and have it calculate a listening window, directivity index, and power response. It will be the first time I have used that feature of Vituixcad.
j.
Attachments
Looks pretty good so far, only a few bumps in the tweeter of a dB or two left.
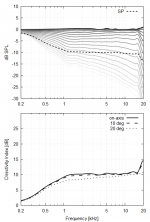
Vituix will give you a response but you don't have enough vertical data or fine enough horizontal data to be sure that what it predicts is what you have.
You do actually need 5 to 10 degree resolution over the full 360 degrees in both directions for an accurate power response and free space DI. Limiting it to the frontal hemisphere cuts down the measurements and allows you to get close enough to guess what the full space will do.
The accuracy of how you take the polar data matters too for this sort of thing much more than a quick look to see that the off axis isn't too bad.
Having a rotation table with index marks allows you to take repeatable polar measurements and make sure you have taken them with the mic the same distance relative to the source, the vituixcad document I linked before explains it better than me.
If you are already doing that then ignore the above 🙂
looks good, but i would rotate the woofer one pin hole to the right
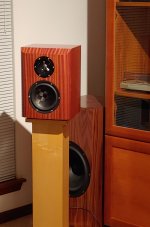
Ha! I knew someone would bring that up...The textreme checkerboard pattern on this pair of drivers does not look right if it is vertical or horizontal. The factory managed to align the pattern with one pair of screw holes, but the pattern is not symetrically aligned. It is off-center, so it does not look right. Perhaps this is for resonance control, assymetry being less resonant. In any case, an angled look seemed to work best for aesthetics.
I know this is a big deal for some people... the textreme thread was consumed with this issue for several dozen posts.
You do actually need 5 to 10 degree resolution over the full 360 degrees in both directions for an accurate power response and free space DI. Limiting it to the frontal hemisphere cuts down the measurements and allows you to get close enough to guess what the full space will do.
The accuracy of how you take the polar data matters too for this sort of thing much more than a quick look to see that the off axis isn't too bad.
Having a rotation table with index marks allows you to take repeatable polar measurements and make sure you have taken them with the mic the same distance relative to the source, the vituixcad document I linked before explains it better than me.
10 degree over 360 degrees sounds like a lot of work. Perhaps I will learn to be happy with the measurements I have. It can be a future project.
I pushed for high accuracy in my measurments. I taped a paper protractor to the top of the cabinet and lined it up with the mic, and I measured the distance from the baffle centerline to the mic for each sweep. I used an improvised rotation table. Realistically I estimate my margin of error was +/- 2 degrees on angle, and +/- 1 cm on distance.
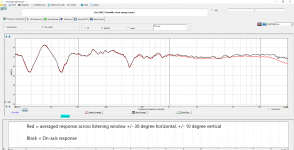
I averaged the response across a +/- 30 degree horizontal and +/- 10 degree vertical window, and I compare it to the on-axis.
Looks pretty good so far, only a few bumps in the tweeter of a dB or two left
The perturbations in the on-axis between 3k and 7k do not show up in the listening window curve, so it would seem to be diffraction. Other than baffle step, I don't believe in correcting for diffraction. However, I might try reducing the tweeter level by 1 dB. I have a slight elevation from 4k to 10k, and on some music I think I can hear it. I also want to experiment with a 1.6 kHz crossover between mid and tweeter.
Later on I want to do outdoor ground plane measurements to really dial in the lower crossover. But right this moment it is 13 degrees F (-10.5 C) outside, so that is not happening soon.
I am taking seriously AllenB's thoughts/concerns. I want to start with my raw driver responses, and see if I can create an equivalent DSP filter from Vituixcad simulation.
I appreciate everyone's thoughts.
Attachments
What are you hoping to learn from the listening window average? As data, it seems to be an element of the spinorama commercial speaker evaluation criteria... As a DIY tool it stops short of room power and goes past listening axis response.
From the Toole and Olive preference research the listening window is the most representative of the way the speaker was rated. It also represents an area of space where a number of people could be listening so having the listening window be very similar to the on axis response suggests that the speaker will sound very similar over that area. Being a spatial average it does get smooth minor irregularities between curves due to diffraction etc. but the biggest problems should remain, checking the individual curves is still good practice because a flat result might be because there was a big dip and a big peak that cancelled out.As data, it seems to be an element of the spinorama commercial speaker evaluation criteria...
Your baffle is symmetric horizontally so you could get away with half the measurements and just mirror them. Vertically you couldn't do that but lying the speaker on it's side and using the rotation table makes it fairly easy.10 degree over 360 degrees sounds like a lot of work. Perhaps I will learn to be happy with the measurements I have. It can be a future project.
If you took the full set of measurements that are needed for the Early reflections curve then you could compute the ERDI with accuracy but that is still quite a lot of measurements, you could cheat and only use 3 rear measurements as appeared in the way the standard was first written, but you see here the effect of that on the DI.
Spinorama! (also known as CTA/CEA 2034 but that sounds dull, apparently) | Page 3 | Audio Science Review (ASR) Forum
Working out the soundpower is difficult without making all the measurements. As you can see in this graph no off axis curve is particularly representative of the SP curve.
That sounds good. I intend to make myself one where I can use a drop pin to make it repeatable and use Earl Geddes tip to make it out of two pieces of melamine face board with a little bit of grease in between.I pushed for high accuracy in my measurments. I taped a paper protractor to the top of the cabinet and lined it up with the mic, and I measured the distance from the baffle centerline to the mic for each sweep. I used an improvised rotation table. Realistically I estimate my margin of error was +/- 2 degrees on angle, and +/- 1 cm on distance.
I wasn't suggesting you try and equalise diffraction although from the normalised curves there seemed to be a couple of persistent bumps. They might be worth looking at and with the EQ in the Hypex some shelving or Boost Q with low Q could be useful in flattening out the overall response a little more, it is surprising how much difference that sort of thing can make. Flat isn't always right but sloping up is rarely preferred.The perturbations in the on-axis between 3k and 7k do not show up in the listening window curve, so it would seem to be diffraction. Other than baffle step, I don't believe in correcting for diffraction. However, I might try reducing the tweeter level by 1 dB. I have a slight elevation from 4k to 10k, and on some music I think I can hear it.
Attachments
- Home
- Loudspeakers
- Multi-Way
- New active Satori Textreme