It seems some more graphics would be useful so here are some more plots.
First, here is the impulse response. You will see that within 2ms most of the impulse is done. You can also see a reflection at about 6ms after the start of the impulse. I was measuring on my front steps and the refection comes from the house approximately 3 feet or 1m away (2m or 6 ft round trip)
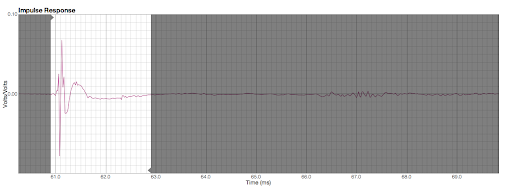
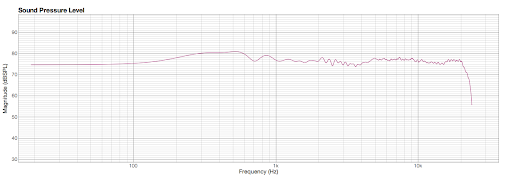
5msec window NO SMOOTHING.
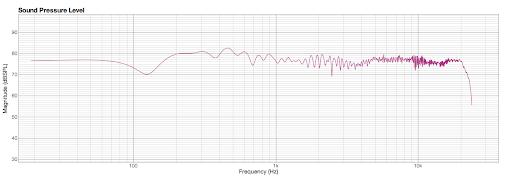
10ms window (NO SMOOTHING) includes reflection. I believe a good portion of the dips and humps in the response 100hz and up can be attributed the the summation of the rear response reflected off the house.
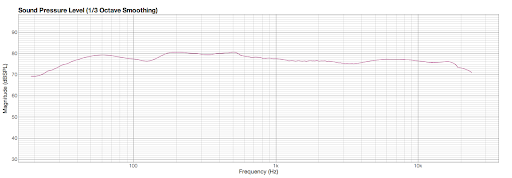
The remainder of these include 1/3 octave smoothing. IMO, with all the reflections included in the data it becomes less useful for fine tuning the response.
20ms.
50ms

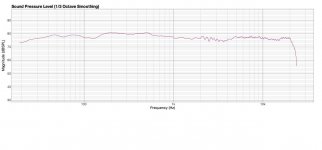
100ms. Of course at this larger window in time, the resolution gets more detailed at the lower frequencies. You can still see the effects of reflections.
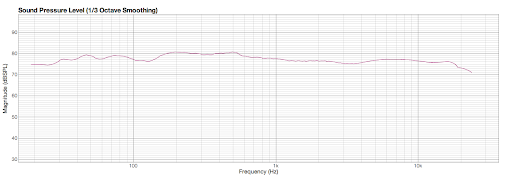
In order to get more accurate data by using a longer window in time, I would need to move more equipment outside and perform the measurements at a greater distance from surrounding obstacles.... or get my self a proper anechoic chamber. 🙂
First, here is the impulse response. You will see that within 2ms most of the impulse is done. You can also see a reflection at about 6ms after the start of the impulse. I was measuring on my front steps and the refection comes from the house approximately 3 feet or 1m away (2m or 6 ft round trip)
5msec window NO SMOOTHING.
10ms window (NO SMOOTHING) includes reflection. I believe a good portion of the dips and humps in the response 100hz and up can be attributed the the summation of the rear response reflected off the house.
The remainder of these include 1/3 octave smoothing. IMO, with all the reflections included in the data it becomes less useful for fine tuning the response.
20ms.
50ms
100ms. Of course at this larger window in time, the resolution gets more detailed at the lower frequencies. You can still see the effects of reflections.
In order to get more accurate data by using a longer window in time, I would need to move more equipment outside and perform the measurements at a greater distance from surrounding obstacles.... or get my self a proper anechoic chamber. 🙂
Last edited:
Indeed it does... based on the impulse
Agreed. And I did use larger time windows to get more accurate data to tune the bottom end.
What software are you using? That is a cool feature... or are you manually pasting the two results using a graphic editor?
I use HBX V6 (hobbybox) it is only in German available. And yes the mls software can do that
I paste your 5msec no smoothing and 50 msec 1/3 smoothing at 1khz with ms-paint.
Still a nice result I only not understand why you not drop the low end a bit or raise the response above 1kHz to become a more flat spl. That shout be easy with active approach.
the spl between 150-1kHz has to drop 3db
Attachments
Last edited:
In order to get more accurate data by using a longer window in time, I would need to move more equipment outside and perform the measurements at a greater distance from surrounding obstacles.... or get my self a proper anechoic chamber. 🙂
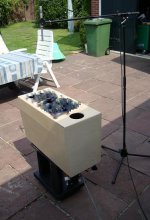
The advantage of MLS is you do not need a special room.
This is what I did. I placed the loudspeaker on its back speakers facing upwards.
From the heaven I do not espect reflections. And the time that the reflection comes back of the ground is easy to calculate.
(344m/sec)distance from floor mtr = sec
And not al reflections are in the direction of the mic. So with 20-50msec windows this works perfect.
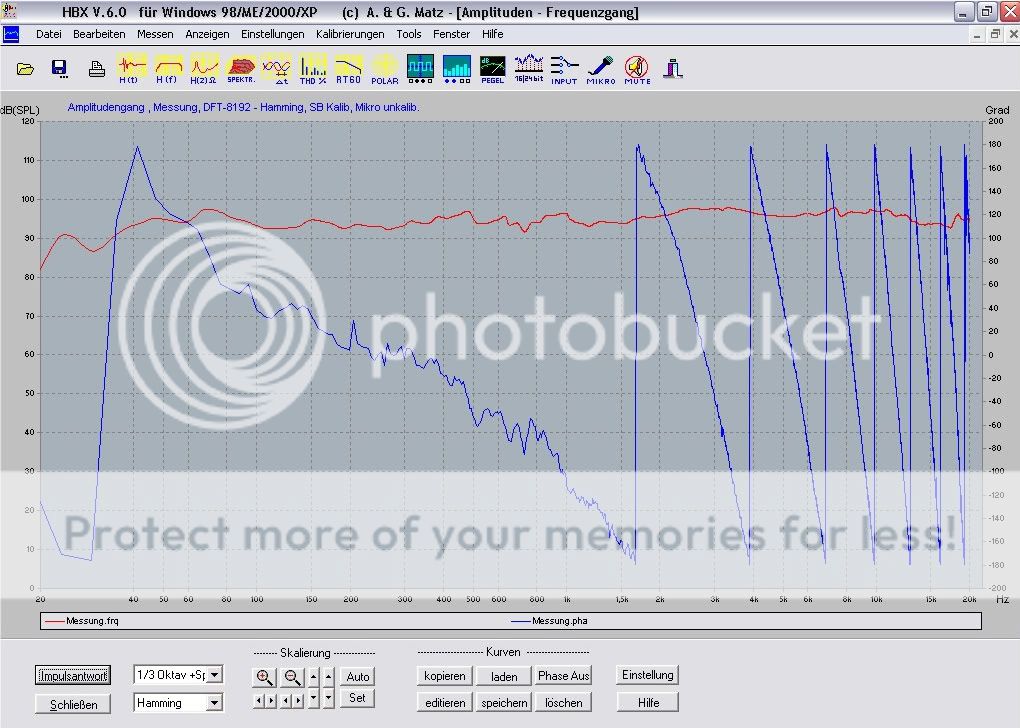
measured this way with 170msec window 1/3 okt smoothing and hamming filter the blue line is the phase.
Attachments
Last edited:

The advantage of MLS is you do not need a special room.
This is what I did. I placed the loudspeaker on its back speakers facing upwards.
From the heaven I do not espect reflections. And the time that the reflection comes back of the ground is easy to calculate.
(344m/sec)distance from floor mtr = sec
And not al reflections are in the direction of the mic. So with 20-50msec windows this works perfect.
measured this way with 170msec window 1/3 okt smoothing and hamming filter the blue line is the phase.
I don't think that method would lend itself to measuring a dipole system. 🙂
I don't think that method would lend itself to measuring a dipole system. 🙂
It is also good for a dipole. place it 2mtr above the floor mic 1mtr higher the reflection has to come from 6mtr (17msec) and in the open field the reflection will not bundle like in a room.
it is 6mtr/(344m/sec)=17msec the formula above is faulty
Think out of the box😀
Last edited:
It is also good for a dipole. place it 2mtr above the floor mic 1mtr higher the reflection has to come from 6mtr (57msec) and in the open field the reflection will not bundle like in a room.
I think setting up sanedesign's speakers horizontally @ 2m above ground would be pretty tricky.
Sanedesign
2” is a good size for maintaining dipole directivity over 1.6 - 4.6 khz
But not many options in 2”ers:
What model # is it?
To choose, it did you see some test results?
How happy are you with it?
Thanks
2” is a good size for maintaining dipole directivity over 1.6 - 4.6 khz
But not many options in 2”ers:
What model # is it?
To choose, it did you see some test results?
How happy are you with it?
Thanks
Still a nice result I only not understand why you not drop the low end a bit or raise the response above 1kHz to become a more flat spl. That shout be easy with active approach.
Yes, you are absolutely correct. It is easy for me to make very flat response and I have tried configuring with much flatter response but I definitely prefer this slope as it is better perceived as flat to my ears. This curve tends, at least in my opinion, to provide a much more realistic experience, especially when listening at higher levels and/or female vocalists.
Linkwitz has written extensively about optimum loudspeaker response and a tendency for increased sensitivity at higher frequencies. The basic idea is that our ears are more sensitive to the higher frequencies especially at the angles normally presented by a typical stereo speaker orientation.
Polar response
ORION-3
2” is a good size for maintaining dipole directivity over 1.6 - 4.6 khz
But not many options in 2”ers:
What model # is it?
To choose, it did you see some test results?
How happy are you with it?
Your right about limited choices... I found the Dayton RS52
And I found others that had tested it.
Midrange test data
Dayton Reference Series Midrange RS52AN-8
It fit my requirements quite well and thus I'm happy with it. I wouldn't recommend crossing much lower than 1500Hz however.
Yes, I use the low shelf filter with some satisfaction. It surely isn't as good as using a proper Linkwitz transform due to a bunch of reasons I can't adequately explain.
The MiniDSP does look good but I wonder if one would be required to purchase other items in addition (op-amps) ?
I have triede both. Originally I had the Behringer DCX2496, and now I have MiniDSP. Even the stand alone MiniDSP is much better sounding than Behringer. I have MiniDIGI and MiniAMP as well, and don't use the analog in/outs at all (just tested it against the Behringer) - but the analog part of MiniDSP is better than Behringer. miniDSP is also much more flexible since you can use analog, I2S and spdif output as well as singele end or blanced analog in/outputs. For the filter it does the same as Behringer, and on top of that also FIR filters witht the advanced plug in.
the Dayton RS52 in 2006 was $68, now 4 years later (if its the same) its $41
Dayton RS52AN-8 2" Dome Midrange | Parts-Express.com
Thanks sd, youve got me thinking . . .
Dayton RS52AN-8 2" Dome Midrange | Parts-Express.com
Thanks sd, youve got me thinking . . .
First off, very nice work, sanedesign!
Thanks for that link - bookmarked.
But - although the DCX can't do Linkwitz transform, it does offer a low shelf filter. Is that not close enough?
Also, why are cascaded filters important? The Linkwitz page linked in your thread is giving me a "Server not found" error.
Linkwitz transform can be realised using notch filter and shelving lowpass. It is not required for low-Q woofer equalisation as normally two shelving lowpass will do.
Cascaded filter:
Crossover topology mistakes


gainephile, could you explain further how the parallet Topology fails because of the phase shift that happens?
From Linkwitz,
I have always confused myself on how that happens.
From Linkwitz,
In the 4-way example, the 50 Hz transition from SW to W will be flat as designed. The 50 Hz highpass, though causes enough phase shift at 200 Hz for W so that W and M do not add properly. The M-channel 200 Hz highpass has the same phase shift as the 200 Hz lowpass in the W-channel, but the M-channel does not duplicate the phase shift of the 50 Hz highpass in the W-channel.
Outputs M and T might add up properly for the 2 kHz crossover, if the 200 Hz highpass in the M-channel adds little phase shift at 2 kHz.
I have always confused myself on how that happens.
Yes, I do wish I could cascade my filters because I do trust Linkwitz entirely ... but I am not sure I can see the negative effects of my apparently faulty crossover setup.
If I could implement the cascaded filter with my DCX I would.
Yes, you are absolutely correct. It is easy for me to make very flat response and I have tried configuring with much flatter response but I definitely prefer this slope as it is better perceived as flat to my ears. This curve tends, at least in my opinion, to provide a much more realistic experience, especially when listening at higher levels and/or female vocalists.
Linkwitz has written extensively about optimum loudspeaker response and a tendency for increased sensitivity at higher frequencies. The basic idea is that our ears are more sensitive to the higher frequencies especially at the angles normally presented by a typical stereo speaker orientation.
Polar response
ORION-3
I agreed. When I first looked at the response graphs on the first page I realised how well you have done your speakers. It is a remarkable achievement.
I am in a similar pace and am currently trying to find out the optimal frequency response curve. I have tried the Linkwitz suggested curve. It is much better than a ruler flat response. However, Linkwitz changed the curves a number of times possibly within a reasonably short time window, which suggests to me that perhaps more experiments are needed to come up with a final curve.
It is amazing how our ears are so sensitive in the region from 800Hz to 8k. A fraction of a dB difference can make or break a system. Having achieved a number of "perfect-on-paper" response curves but having not achieved the desired "perfect" sound, close, but not perfect, last week, I installed a total of 14 trimpots in my active analogue crossovers at various places to adjust the levels, filter frequencies and Q of filters so that I can do the very fine adjustment (a fraction of a dB) between 800Hz to 8k. I am still in the process of doing the adjustments. Once done, I will see how the frequency response looks like.
I have been so busy these days and have been away from the diyAudio forum for a while. I don't know if this topic has been discussed recently. Please point me to the right links, etc.
We most definitely need to establish a "perfect" frequency response curve.
Regards,
Bill
Last edited:
By the way, comparing your measurement to mine, mine is higher at the 1kHz region, i.e. mine is much closer to what Linkwitz recommends. I have not tried a response like yours (i.e. 2dB down from 500Hz to 1kHz) and since I am designing my custom analogue filters there is no easy way for me to try what you have.
Would you mind sharing your experience in deriving your frequency response curve?
Would you mind sharing your experience in deriving your frequency response curve?
Yes, I think that would be helpful. Before that however, I think we also need a well defined standard test regimen in order to accurately compare notes.We most definitely need to establish a "perfect" frequency response curve.
Happy to collaborate because I can't say with certainty that I've "Arrived" yet. 🙂By the way, comparing your measurement to mine, mine is higher at the 1kHz region, i.e. mine is much closer to what Linkwitz recommends. I have not tried a response like yours (i.e. 2dB down from 500Hz to 1kHz) and since I am designing my custom analogue filters there is no easy way for me to try what you have.
Would you mind sharing your experience in deriving your frequency response curve?
I've been trying to re-create Linkwitz' curve so that was my goal and it seems then that you are ahead of me. So I would be happy to hear your impressions!
When I performed the outdoor tests I called that configuration SANE9 - 4Way and then proceeded to move the speaker indoors because that is where I listen to them. 😉
To be clear, the outdoor tests were only a 4way with only GEQ to achieve desired curve and I didn't quite achieve the somewhat variable LinkWitz' Curve (LWC) but fairly close anyways. And as you noticed, the response was about 2db down from the LWC in a range....
But the sound was delicious.


 and I didn't worry too much about the small discrepancy.
But after moving indoors things get pretty messy during measurements with all the room response to consider.
Starting at the bottom end, I've added the 15" woofer in the hopes that it might help out the low end. I also added 3 PEQs in the bottom end at reduce room modes.
-5 at 31.5
-8 @ 63Hz
-9 @ 89
I think the response may be smoother but I don't have clear testing data because I was listening alot so I can't "prove" that the response is much smoother but I can definitely say it "feels" better. 😀
I also started working on figuring out the impact of room reflections on frequency response between 100 - 1kHz. Testing data confirmed BIG dips in the response due to rear output reflections. I fooled around with the GEQ but that was a relatively useless exercise. The application of some relatively simple wall treatment was a great success however. This little change made a much more significant effect than I had anticipated by reducing the negative effects of wall reflections by at least 2db.
I also added 3 PEQs at 355, 450 and 630 to further reduce some of these negative effects of wall bounce reduce baffle hump. I've also bumped up the GEQ about 1db between in the same range as the PEQs. I called this SANE10 so I can go back to the outdoor settings easily. I believe it would test a little closer to the LCW now.
But I've been writing alot on this website instead of listening... so I've got to get back to some listening and I'll report back with some findings. I will probably not have many comments on how it sounds until after I've had a chance to live with it for a while. I may end up reversing the Midrange PEQs. I also want to take it back outside and confirm the outdoor response measurements.
Tomorrow I'm going fishing so don't hold your breath waiting for first impressions of these changes. 😎
Wow, what can I say? I am impressed by your reponse.
You obviously clearly understand the objectivity and subjectivity of this whole game. While based on objective measurements you don't stubornly hold onto any established belief and don't make rushed conclusions, with an open mind to everything and be ready to explore... I am sure an "englightened" guy like yourself can find your way to success much more quickly than a stuborn person like myself.
I am gethering my thoughts on this so I may divide the post into a number of them in the immediately following...
First, the need for a "Perfect" Frequency Response Curve (PFRC).
While we have measurements, the difficult thing is that without a proven PFRC we don't know how to shape the FRC. So far it has been proven that a ruler flat FRC does not correspond to the best subjective experience, while a curve similar to Linkwitz corresponds to a better subjective experience. But there is no prove that the Linkwitz' curve is "perfect". While the Linkwitz' curve (or a PFRC) may still be in the process of evolution (I say this because from Linkwitz' site it is obvious his curve has been derived subjectively, rather than scientifically based on proper psychoaccoustic tests, and it has been undergoing a number of changes within a short period), we have no "ruler" to base on while shaping the FRC.
Of course, this is based on the assumption that such a PFRC exists. Without propositions, maths / science would not exist. Here, we need such a proposition that PFRC exists. Unfortunately, human can only work within the limits of what a human mind is made of. Of course, we can go circles here, as what is good sound or bad sound can only be subjective. But for now, I must give that up otherwise I can't make any progress.
I would be happy to side with the objective camp if it provides the solution. But the question is that without this "ruler" or PFRC, what would I do with all my measurements?
This forces me to go and find a solution in a subjective way, i.e. installing 14 trimpots and do micro-adjustments to find whatever responses most welcome by my ears / mind, while at the same time, fully understanding that my mind is the most unreliable machine that I can use. I am doing everything to prevent my mind from tricking me.
Until that PFRC is derived, the whole excercise for me seems to be a subjective one.
- Status
- Not open for further replies.
- Home
- Loudspeakers
- Multi-Way
- My fully active 4 way OB with 8 Drivers + 15" subwoofer